This comprehensive documentation will help users by explaining the basics of the EM-DAT international disaster database.
Start by exploring one of the following options:
Use the Table of Content in the left sidebar or the menu below to navigate through the documentation.
Use the search engine in the top-right corner.
Print or export the documentation to PDF or one of its sections using the print option in the right sidebar.
1 - Introduction
Overview of EM-DAT and Latest Updates
Why Document EM-DAT?
Since its creation in 1988, the Emergency Events Database (EM-DAT) has undergone many changes. Tracing these changes over time was a difficult task that required combing through the archives to reconstruct the history of the database structure, concepts, and definitions. This versioned documentation gives you a rigorous tool which you can use to track its evolution and access up-to-date information.
Warning
EM-DAT data is delivered “as is” without any guarantees of completeness or accuracy. While EM-DAT can provide valuable insights and information, it is crucial to be aware of its limitations so that you can make informed decisions and meaningful interpretations. Please carefully review the metadata and any accompanying documentation to understand the scope and limitations of the data. Additionally, you can review the Known Issues and Limitations section of the dataset to identify any potential caveats or areas of concern.
EM-DAT Documentation
EM-DAT documentation 2023.09 was the first release with a Version Control System. As the version number indicates, it was released in September 2023. The current version is 2025.05. The 2023.09 release introduced breaking changes in the public table format, a backup of the legacy public table is available here. It is available under the same conditions.
First version 2023.09 of the EM-DAT Documentation.
EM-DAT Documentation: Removed EM-DAT guidelines and replaced them with this new documentation website.
EM-DAT Public Data: Made minor changes in the column names and their styling.
EM-DAT Public Data: Added new column ‘Historic’.
EM-DAT Public Data: Added new column ‘Classification Key’.
EM-DAT Public Data: Added new column ‘Entry Date’.
EM-DAT Public Data: Added new column ‘Last Update’.
EM-DAT Public Data: Removed column ‘Year’. Use ‘Start Year’ instead.
EM-DAT Public Data: Removed column ‘Seq’. Sequential number can be retrieved from the ‘DisNo.’ column instead.
EM-DAT Public Data: Removed column ‘Disaster Subsubtype’. Use the new 4-level classification tree instead.
EM-DAT Public Data: Replaced ‘Glide’ Column with ‘External IDs’.
EM-DAT Public Data: Replaced column ‘Continent’ with the ‘Region’ column based on UN M49 standard.
EM-DAT Public Data: Replaced column ‘Region’ with the ‘Subregion’ column based on UN M49 standard.
EM-DAT Public Data: Replaced the two columns ‘Associated Dis’ and ‘Associated Dis2’ with one column ‘Associated Types’. The new column can store an unlimited number of associated types.
EM-DAT Public Data: Replaced columns ‘Adm Level’, ‘Admin1 Code’, ‘Admin2 Code’, and ‘Geo Locations’ with one single column ‘Admin Units’ with JSON entries.
EM-DAT Public Data: Columns ‘OFDA Response’, ‘Appeal’, and ‘Declaration’ are now strictly binary (either ‘Yes’ or ‘No’).
EM-DAT Public Data: Reviewed and made minor corrections to the data content during the documentation process.
EM-DAT Documentation and Public Table: Added HANZE to the External IDs column.
Updated broken links
EM-DAT Documentation: Updated broken links for OECD CPI in Economic Adjustment
Overview of EM-DAT
In 1988, the Centre for Research on the Epidemiology of Disasters (CRED) launched the Emergency Events Database (EM-DAT). EM-DAT was created with the initial support of the World Health Organization (WHO) and the Belgian Government. Since 1999, EM-DAT has been supported by the Bureau for Humanitarian Assistance (BHA, previously the Office of US Foreign Disaster Assistance, or OFDA) within the United States Agency for International Development (USAID).
The initial objective of the database is to serve the purposes of humanitarian action at the national and international levels. Today, EM-DAT is also used to rationalize disaster preparedness and decision-making while providing an objective basis for vulnerability and risk assessment.
The EM-DAT database records mass disasters as well as their health and economic impacts at a country level (see Data Structure). The database contains core data on the occurrence and effects of 26,000 disasters worldwide from 1900 to the present. The database is compiled from various sources of information, including UN agencies, non-governmental organizations, insurance companies, research institutes, and press agencies (see Sources).
How to Cite?
To acknowledge EM-DAT as a data source in publications (e.g., documents, PowerPoint presentations, posters, or image charts), we recommend the following citation syntax:
Since the Emergency Events Database (EM-DAT) is regularly updated, we advise including the access date to ensure reference accuracy. If you use EM-DAT for a scientific publication, we would appreciate citations to the following database descriptor article:
Delforge, D., Wathelet, V., Below, R., Lanfredi Sofia, C., Tonnelier, M., van Loenhout, J. A. F. & Speybroeck, N.: EM-DAT: The Emergency Events Database, International Journal of Disaster Risk Reduction, 105509, https://doi.org/10.1016/j.ijdrr.2025.105509, 2025.
Highlighted Publications
Check our latest EM-DAT-related research paper:
Charalampous, P., Speybroeck, N., van Loenhout, J. A. F., Pluen, G., Delforge, D.: The 2024 Spain Floods: A Call for Resilience and the Duty of Memory. International Journal of Public Health, 70:1608236, https://doi.org/10.3389/ijph.2025.1608236, 2025.
Tonnelier, M., Delforge, D., Below, R., Munguía, J. A. T., Saegerman, C., Wathelet, V., Van Loenhout, J. A. F. & Speybroeck, N.: What makes an epidemic a disaster: the future of epidemics within the EM-DAT International Disaster Database. BMC Public Health, 25, 21, https://doi.org/10.1186/s12889-024-21026-2, 2025.
All CRED publications relative to EM-DAT are accessible from our online repository.
For a comparison of available disaster loss databases, we recommend reading:
Mazhin, S. A., Farrokhi, M., Noroozi, M., Roudini, J., Hosseini, S. A., Motlagh, M. E., Kolivand, P., and Khankeh, H.: Worldwide disaster loss and damage databases: A systematic review, J Educ Health Promot, 10, 329, https://doi.org/10.4103/jehp.jehp_1525_20, 2021.
For a disaster loss dataset based on EM-DAT with improved geocoding, have a look at:
For a comprehensive global overview of natural hazards and disasters, we recommend reading the following online publication:
Ritchie, H., Rosado, P., and Roser M.(2022) - “Natural Disasters.” Published online at OurWorldInData.org. Retrieved from: ‘https://ourworldindata.org/natural-disasters' [Online Resource]
2 - Data Accessibility
How to Access the Data and Legal Conditions for Using EM-DAT
What are the Different EM-DAT Products?
The living EM-DAT Public Data is the main data product, providing disaster impact details by event and country, updated weekly.
The EM-DAT Archive is a validated backup of the EM-DAT Public Data shared to support open and reproducible scientific research.
The EM-DAT HDX Country Profilessummarize yearly disaster data by type and country.
Note
Since the EM-DAT Archive and the EM-DAT HDX Country Profiles are directly derived from the EM-DAT Public Data, this portal is dedicated to the documentation of the EM-DAT Public Data.
How to Download the EM-DAT Public Data?
The public EM-DAT records are accessible from our online data portal public.emdat.be. Access for non-commercial use is free after registration and subject to the Terms of Use. Access for Commercial Use is possible on the basis of an annual paid subscription (see Commercial License).
After registration and login, the data can be downloaded using the EM-DAT “Access Data” Tab or Toolbox (see the figure below) as a flat table in Microsoft Excel format (.xlsx). The EM-DAT database is described in the Data Structure Description section. In particular, the Column Description section contains the description of each column of the public table found in the Excel file.
The Humanitarian Data Exchange (HDX) EM-DAT Country Profiles
In addition, annual data summaries per country (country profiles) are available for download on the Humanitarian Data eXchange platform (see more on HDX here). These consist of aggregated figures, updated weekly, in the following format :
The value of all damage and economic losses directly or indirectly related to the disasters, in the value of the year of occurrence, unadjusted for inflation (see Economic Impact Variables).
Available in the second row, these terms are part of the Humanitarian Exchange Language (HXL) and used in the HDX API to annotate metadata across datasets. See more about the HXL standard. ↩︎
3 - Data Structure and Content Description
In-depth Presentation of the Structure and Content of the Database
3.1 - General Definitions and Concepts
What is a Disaster in EM-DAT?
EM-DAT was designed in 1988 based on an anthropocentric vision of disasters and emergencies1. It considers disasters to be events involving an unexpected and overwhelming harmful impact on human beings. Formally, EM-DAT’s definition of a disaster is:
Definition : Disaster
A situation or event which overwhelms local capacity, necessitating a request to the national or international level for external assistance; an unforeseen and often sudden event that causes great damage, destruction, and human suffering.
EM-DAT inventories only disasters that fit its Inclusion Criteria. EM-DAT records both disasters triggered by natural hazards and technological disasters. The latter are unintentional accidents, and not situations of conflict, violence, or terrorism. For more details, we refer to the Disaster Classification System.
Note
EM-DAT reports disaster impacts per country and per hazard type. However, for some disasters, this simple representation may not capture the situation’s complexity, systemic and composite effects, nor its subsequent uncertainties (see General issues).
Basic Relational Structure of the Various Components of a Disaster Event in EM-DAT
EM-DAT data model records disasters and maps their impacts at the country level. Accordingly, the EM-DAT database references disasters with a unique identifier (see DisNo. in Column Description). A disaster may affect more than one country. In EM-DAT, the country-specific information about the disaster is recorded as an “Impact.” The Impact is the level at which EM-DAT reports entries in the EM-DAT Public Table. To document each Impact, we cross-validate and select information from the sources that are available (see EM-DAT sources and Protocols).
EM-DAT Structure in a Nutshell
A disaster in EM-DAT may have one or more impacts documented in different countries.
Its impact may have one or more sources reporting country-related information.
The country-related information, which is selected depending on the trustworthiness of the source, is reported in the public table.
The figure below provides a visual representation of the foundational structure of the EM-DAT database’s relational model. On the left is the core structure, and on the right, a hypothetical case serves as an illustrative example. To enhance clarity, the relations have been streamlined, omitting certain tables such as dictionaries, focusing solely on the main connections and the underlying logic of the database.
Cardinality, or the nature of the relationship between entities, is denoted by numbers or the letter “N” on each link. For instance, “1, N” signifies a one-to-many relationship. A clear example of this is the link between the “Disaster” and “Impact” tables. This implies that a single disaster entry might correspond to multiple impacts across various countries. Consider a flood affecting multiple nations, such as Belgium and Germany; the connection between these entries is facilitated by the shared DisNo. attribute.
The primary classification of a disaster, such as its main type, is housed in the “Disaster” table. Consequently, all impacts linked by the same DisNo. will have a consistent primary disaster type. However, EM-DAT introduces a nuance with associated disasters linked to the “Impact” table. Unlike the main type, these associated disasters can vary by country. They represent secondary disasters that either result from or occur simultaneously with the main event. An example would be a landslide triggered by a primary flood event, which is considered to be an associated disaster. It’s important to note that associated disasters are optional, leading to their zero-to-many relationship with the “Impact” table.
Each source can provide data for any given variable within the Impact category. During the validation process (as detailed in Encoding, Quality Control, and Validation Procedure), one value is chosen for each variable, which is independent of other variables. Some figures presented in the EM-DAT Public Table are aggregates of various variables and might originate from multiple distinct sources. For example, figures for deaths and missing persons might be reported at different times after an event. After evaluating and selecting from the available data, the Total Deaths column might consolidate information from various sources.
3.3 - EM-DAT Public Table
Content and Presentation of the Database as Publicly Available
Overview
The EM-DAT Public Table is a flat representation of EM-DAT data in a single downloadable table. Most impact variables are part of the public table (see Impact Variables). The public table provides a flat view of the general structure in which each record (row) corresponds to a disaster impacting a country.
About empty cells
For given Impact Figures, empty cells could either refer to a disaster with no impact or a disaster with unknown or unreported impact. See aslo Accounting Biases.
Column Description
Column Name
Type
Description
DisNo.
ID, Mandatory
A unique 8-digit identifier including the year (4 digits) and a sequential number (4 digits) for each disaster event (i.e., 2004-0659). In the EM-DAT Public Table, the ISO country code is appended. See column ISO below.
Historic
Yes/No, Mandatory
Binary field specifying whether or not the disaster happened before 2000, using the Start Year. Data before 2000 should be considered of lesser quality (see Time Bias).
Classification Key
ID, Mandatory
A unique 15-character string identifying disasters in terms of the Group, Subgroup, Type and Subtype classification hierarchy. See Disaster Classification System.
List of identifiers for external resources (GLIDE, USGS, DFO, HANZE), in the format “<source>:<identifier>” and separated by the pipe character ("|").
Event Name
Optional
Short specification for disaster identification, e.g., storm names (e.g., “Mitch”), plane type in air crash (e.g., “Boeing 707”), disease name (e.g., “Cholera”), or volcano name (e.g., “Etna”).
ISO
ID, Mandatory
The International Organization for Standardization (ISO) 3-letter code referring to the Country. The ISO 3166 norm is used. See Spatial Information and Geocoding.
Country
Name, Mandatory
Country where the disaster occurred and had an impact, using names from the UN M49 Standard. See Spatial Information and Geocoding. If multiple countries are affected, each will have an entry linked to the same DisNo..
Subregion
Name, Mandatory
Subregion where the disaster occurred based on UN M49 standard, automatically linked to the Country field. See Spatial Information and Geocoding.
Region
Name, Mandatory
Region or continent where the disaster occurred based on UN M49 standard, automatically linked to the Country field. See Spatial Information and Geocoding.
Location
Text, Optional
Geographical location name as specified in the sources, e.g., city, village, department, province, state, or district. Used to identify corresponding GAUL Admin Units (see GAUL Index and Admin Levels).
Origin
Text, Optional
Additional specifications on the contextual factors that led to the event, e.g., “heavy rains” for floods, or “drought” for a forest fire.
Associated Types
Names List, Optional
List of secondary disaster types cascading from or co-occurring aside from the main type (optional), e.g., a landslide following a flood or an explosion after an earthquake. Separated by the pipe character ("|").
OFDA/BHA Response
Yes/No, Mandatory
Binary field specifying whether or not the (former) Office of US Foreign Disaster Assistance (OFDA) or the Bureau of Humanitarian Assistance (BHA) responded to the disaster.
Appeal
Yes/No, Mandatory
Binary field specifying whether or not there was a request for international assistance from the affected country.
Declaration
Yes/No, Mandatory
Binary field specifying whether a state of emergency was declared in the country.
AID Contribution (‘000 US$)
Unadjusted Monetary Amount (‘000 US$), Optional
The total amount (in thousands of US$ at the time of the report) of contributions for immediate relief activities to the country in response to the disaster, sourced from the Financial Tracking System of OCHA (1992 to 2015). Not maintained after 2015 due to a lack of availability of information. Some aid contribution information can be found at https://fts.unocha.org/.
North-South coordinates mainly for earthquakes and volcanic activity. Sometimes reported for floods, landslides, and storms (mostly when associated with floods).
Longitude
Degrees [-180;180], Optional
East-West coordinates mainly for earthquakes and volcanic activity. Sometimes reported for floods, landslides, and storms (mostly when associated with floods).
River Basin
Text, Optional
Name of affected river basins, typically used for floods.
Start Year
Numeric, Mandatory
Year of occurrence of the disaster.
Start Month
Numeric, Optional
Month of occurrence of the disaster. For sudden-impact disasters, this field is well defined. For disasters developing gradually over a longer time period (e.g., drought) with no precise onset date, this field can be left blank.
Start Day
Numeric, Optional
Day of occurrence of the disaster. For sudden-impact disasters, this field is well defined. For disasters developing gradually over a longer time period (e.g., drought) with no precise onset date, this field can be left blank.
End Year
Numeric, Optional
Year of disaster conclusion.
End Month
Numeric, Optional
Month of conclusion of the disaster. For sudden-impact disasters, this field is well defined. For disasters developing gradually over a longer time period (e.g., drought) with no precise end date, this field can be left blank.
End Day
Numeric, Optional
Day of conclusion of the disaster. For sudden-impact disasters, this field is well defined. For disasters developing gradually over a longer time period (e.g., drought) with no precise end date, this field can be left blank.
Number of people with physical injuries, trauma, or illness requiring immediate medical assistance due to the disaster (see Human Impact Variables).
No. Affected
Numeric, Optional
Number of people requiring immediate assistance due to the disaster (see Human Impact Variables).
No. Homeless
Numeric, Optional
Number of people requiring shelter due to their house being destroyed or heavily damaged during the disaster (see Human Impact Variables).
Total Affected
Numeric, Optional
Total number of affected people (No Injured, No Affected, and No Homeless combined, see Human Impact Variables).
Reconstruction Costs (‘000 US$)
Unadjusted Monetary Amount (‘000 US$), Optional
Costs for replacement of lost assets in thousands of US dollars (‘000 US$) relative to Start Year, unadjusted for inflation (see Economic Impact Variables).
Reconstruction Costs, Adjusted (‘000 US$)
Adjusted Monetary Amount (‘000 US$), Optional
Reconstruction Costs (‘000 US$), adjusted for inflation using the Consumer Price Index (CPI column, see Economic Adjustment).
Insured Damage (‘000 US$)
Unadjusted Monetary Amount (‘000 US$), Optional
Economic damage covered by insurance companies, in thousands of US dollars (‘000 US$), relative to Start Year, unadjusted for inflation (see Economic Impact Variables).
Insured Damage, Adjusted (‘000 US$)
Adjusted Monetary Amount (‘000 US$), Optional
Insured Damage (‘000 US$) adjusted for inflation using the Consumer Price Index (CPI column, see Economic Adjustment).
Total Damage (‘000 US$)
Unadjusted Monetary Amount (‘000 US$), Optional
Value of all economic losses directly or indirectly due to the disaster, in thousands of US dollars (‘000 US$), relative to Start Year, unadjusted for inflation (see Economic Impact Variables).
Total Damage, Adjusted (‘000 US$)
Adjusted Monetary Amount (‘000 US$), Optional
Total Damage (‘000 US$) adjusted for inflation using the Consumer Price Index (CPI column, see Economic Adjustment).
CPI
Conversion Ratio, Optional
Consumer Price Index from OECD used to adjust US$ values for inflation relative to Start Year (see Economic Adjustment).
Admin Units
JSON Array of Objects, Optional
Collection of impacted Administrative Units from the FAO GAUL 2015 referential (Global Administrative Unit Layers 2015). Individual objects correspond to Level-1 or Level-2 Administrative Units, with the corresponding fields adm1_code, adm1_name or adm2_code, adm2_name providing the unique identifier to the geometry in the GAUL layer and the name of the unit, respectively. Geocoding is maintained for non-biological natural hazards from 2000 onwards (see Spatial Information and Geocoding).
Entry Date
Date, Mandatory
The day on which the event record was created in EM-DAT.
Last Update
Date, Mandatory
The last modification of the event or one of its associated records in EM-DAT. This may not result in a modification of the information in the EM-DAT Public Table as modifications to private fields are recorded as well.
3.4 - Disaster Classification System
Historical and Current Classification System of Disasters
A Brief History of the EM-DAT Classification System
EM-DAT’s classification system originally started with a simple 20-type list1. However, in 1992, CRED and other international stakeholders proposed a hierarchical classification system2 that distinguishes natural and man-made disasters (described as technological disasters in EM-DAT). A further distinction was based on the timing of disasters: slow vs. rapid onset disasters.
In the 2000s, CRED collaborated with Munich Re and other stakeholders on a common classification system3. Since then, EM-DAT’s main classification system has followed the logic of referring to the hazard or event triggering the disaster. Consequently, some disasters were reclassified, and some types were removed from the primary classification system. This was the case for famines reclassified as drought for the most part4. However, “famine” offers more information than “drought.” Therefore, in order not to lose this added value, EM-DAT has adopted the secondary classification system of Associated Disasters. This describes disasters that coincide with or result from the primary type.
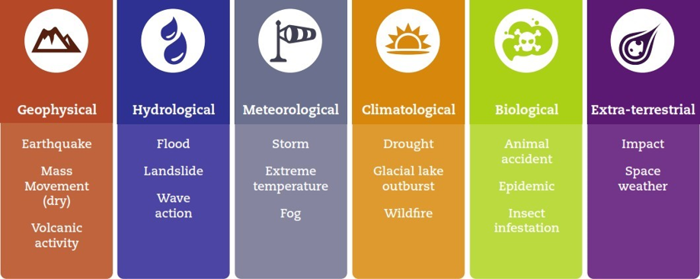
In 2014, the Integrated Research on Disaster Risk (IRDR) working group, which included CRED, established a new reference called the Peril Classification and Hazard Glossary. This document is currently the primary reference for classifying natural hazards in EM-DAT, which divides them into six main groups: Geophysical, Hydrological, Meteorological, Climatological, Biological, and Extra-terrestrial. EM-DAT also includes more detailed subtypes.
Natural Hazards Subgroups and Types in the IRDR Peril Classification and Hazard Glossary
Note
More recently, in 2021, the ISC and UNDRR released Hazard Information Profiles (HIPs). This document regroups and defines more than 300 hazards that have the potential to impact a community. In March 2023, the CRED discussed HIPs during its Scientific and Technological Advisory Group (STAG) meeting in Brussels. As a result, the CRED is working on a roadmap to make its classification system interoperable with HIPs.
Main Classification Tree
Changes in the Classification Tree
In September 2023, the EM-DAT Classification Tree was updated and simplified to facilitate user queries and filtering. The current tree, which is based on four depth levels, replaces the former tree with three plus two optional depth levels. The ‘Complex’ disaster group was removed (14 entries). If you wish to establish the correspondence between new and former disaster types, you may download this backup of EM-DAT prior to the update and join the two datasets based on the DisNo. column.
The main classification tree has four levels of depth, so disasters are divided into groups, subgroups, types, and subtypes, as presented in the EM-DAT Public Table columns. The two EM-DAT disaster groups are ‘Natural’ and ‘Technological’. The table below shows the complete tree for the ‘Natural’ and ‘Technological’ groups, with the occurrence for each subtype. Their corresponding definitions are available in the Classification Glossary.
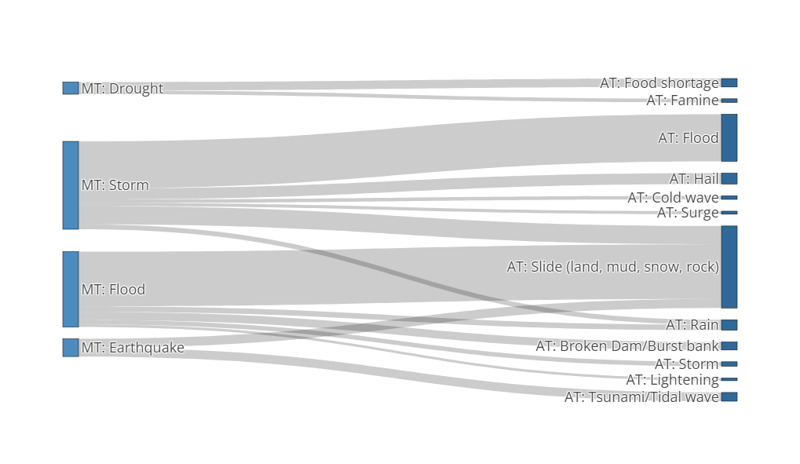
In addition to the main classification system, EM-DAT makes it possible to refer to “associated disasters” to describe disaster events in more details (see Associated Dis in EM-DAT Public Table). They represent subsequent or co-occurring hazards that may have contributed to the disaster impact. These associated disasters may not fit into the main classification system and do not have a hierarchical structure. This additional tagging system allows for a better description of disaster events, particularly multi-hazard ones. The figure below shows the main associations found in the database.
Sankey diagram of the associations between main disaster types (MT) and associated disaster types (AT) in EM-DAT. The figure only reports MT-AT associations having an occurrence >= 50 in the database. Gray band sizes between MT and AT are proportional to the occurrence of the association in EM-DAT.
Last updated: September 5, 2023.
About 14% of disaster entries in EM-DAT have an associated disaster type, and only 3% mention two associated types. The most common associations are floods with landslides (24% of associations), storms with floods (21%), and storms with landslides (8%). Earthquakes are sometimes associated with landslides (4%) and tsunamis (4%) when their damage is deemed negligible compared to ground movement damage.
DHA-UNDRO, IDNDR, UNEP, WFP, WHO/PAHO, USAID/FHA, IFRC, and CRED: Proposed principles and guidelines for the collection and dissemination of disaster-related data, Brussels, Belgium, 1992. ↩︎
Below, R., Wirtz, A., and Guha-Sapir, D.: Disaster Category Classification and peril Terminology for Operational Purposes, Centre for Research on the Epidemiology of Disasters, Munich Re, Brussels, Belgium, 2009. ↩︎
Below, R., Grover-Kopec, E., and Dilley, M.: Documenting Drought-Related Disasters: A Global Reassessment, The Journal of Environment & Development, 16, 328–344, https://doi.org/10.1177/1070496507306222, 2007. ↩︎
Number of disasters that occurred at the country level in EM-DAT (1900-present) as of September 5, 2023. ↩︎
3.5 - Classification Glossary
Definitions of Disaster Types
EM-DAT’s definitions related to the group of natural hazards mainly refer to the IRDR Peril Classification and Hazard Glossary (see A Brief History of the EM-DAT Classification System). These are reported in the following sections by disaster subgroups.
EM-DAT definitions related to the groups of complex disasters and technological hazards are listed separately in the Complex and Technological Hazards section. These are legacy definitions from the EM-DAT project and do not refer to a particular glossary serving as an international standard.
About Definitions
Some definitions have undergone minor modifications or derivations, which are noted at the end of each section. Some terms, which are not explicitly defined in the referenced glossaries, have been left undefined. As notified in the Disaster Classification System, the Hazard Information Profiles (HIPs) serve as a comprehensive glossary for those interested in the definitions of different hazard types that are beyond the EM-DAT scope.
3.5.1 - Biological Hazards
Term
Level
Definition
Source
Biological hazard
Subgroup
A hazard caused by exposure to living organisms and/or their toxic substances (e.g., venom, or mold) or vector-borne diseases that they may carry. Examples are venomous wildlife and insects, poisonous plants, algae blooms, and mosquitoes carrying agents that causes disease such as parasites, bacteria, or viruses (e.g., malaria).
IRDR
Animal incident
Type Subtype
Human encounters with dangerous or exotic animals in both urban and rural environments.
IRDR
Epidemic
Type
Either an unusual, often sudden, increase in the number of cases of an infectious disease that already existed in the region (e.g., flu, or E. coli) or the appearance of an infectious disease previously absent from the region (e.g., plague, or polio).
Either an unusual, often sudden, increase in the number of cases of an infectious disease that already existed in the region (e.g., flu, or E. coli) or the appearance of an infectious disease previously absent from the region (e.g., plague, or polio).
An unusual increase in the number of cases caused by exposure to bacteria either through skin contact, ingestion, or inhalation. Examples include salmonella, Methicillin-Resistant Staphylococcus Aureus (MRSA), and cholera, among others.
An unusual increase in the number of cases caused by exposure to a parasite, i.e., an organism living on or in a host. Exposure to parasites occurs mostly through contaminated water, food, or contact with insects, animals, etc. Examples are malaria, Chagas disease, giardiasis, and Trichinellosis.
An unusual increase in the number of cases caused by exposure to fungi either through skin contact, ingestion, or inhalation of spores. Examples are fungal pneumonia, fungal meningitis, etc.
A type of biological hazard caused by prion proteins. Prion diseases or transmissible spongiform encephalopathies (TSEs) are a family of rare progressive neurodegenerative disorders that affect both humans and animals. They are characterized by long incubation periods and neural loss. Examples are Bovine Spongiform Encephalopathy (BSE), Creutzfeldt-Jakob Disease (CJD), Kuru, etc.
The “Infectious disease” definition corresponds to the definition of “Disease” in the IRDR glossary. The same definition is used to define “Epidemic” in the EM-DAT glossary. ↩︎↩︎
These definitions have been adapted and derived from the IRDR definition of “Insect infestation”. ↩︎↩︎↩︎↩︎
3.5.2 - Climatological Hazards
Term
Level
Definition
Source
Climatological hazard
Subgroup
A hazard caused by long-lived, meso- to macro-scale atmospheric processes ranging from intra-seasonal to multi-decadal climate variability.
IRDR
Drought
Type Subtype
An extended period of unusually low precipitation that produces a shortage of water for people, animals, and plants. Drought is different from most other hazards in that it develops slowly, sometimes even over the years, and its onset is generally difficult to detect. Drought is not solely a physical phenomenon because its impacts can be exacerbated by human activities and water supply demands. Drought is therefore often defined both conceptually and operationally. Operational definitions of drought, i.e., the degree of precipitation reduction that constitutes a drought, vary by locality, climate, and environmental sector.
IRDR
Glacial lake outburst flood
Type Subtype
These floods occur when water held back by a glacier or moraine is suddenly released. Glacial lakes can be at the front of the glacier (marginal lake) or below the ice sheet (sub-glacial lake).
Any uncontrolled and non-prescribed combustion or burning of plants in a natural setting such as a forest, grassland, brush land or tundra, which consumes natural fuels and spreads based on environmental conditions (e.g., wind, or topography). Wildfires can be triggered by lightning or human actions.
IRDR
Forest fire
Subtype
A type of wildfire in a wooded area.
IRDR
Land fire (Brush, Bush, Pasture)
Subtype
A type of wildfire in a brush, bush, pasture, grassland, or other treeless natural environment.
The definition of “Glacial lake outburst flood” corresponds to the definition of “Glacial lake outburst” in the IRDR glossary. ↩︎
Not defined in the IRDR glossary but adapted from the “Wildfire” and “Forest fire” definitions. ↩︎
3.5.3 - Extra-terrestrial Hazards
Term
Level
Definition
Source
Extra-terrestrial hazard
Subgroup
A hazard caused by asteroids, meteoroids, and comets as they pass near to the Earth, enter the Earth’s atmosphere, and/or strike the Earth, and by changes in interplanetary conditions that effect the Earth’s magnetosphere, ionosphere, and thermosphere.
IRDR
Impact
Type
A type of extra-terrestrial hazard caused by the collision a meteoroid, asteroid, or comet with the Earth.
IRDR
Airburst
Subtype
An explosion of a comet or meteoroid within the Earth’s atmosphere without striking the ground.
IRDR
Collision
Subtype
An impact caused by the collision of a meteoroid, asteroid, or comet with the Earth’s ground.
A general term for extra-terrestrial weather conditions driven by solar eruptions such as geomagnetic storms, radio disturbances, and solar energetic particles.
IRDR
Energetic particles
Subtype
Emissions from solar radiation storms consisting of pieces of matter (e.g., protons and other charged particles) moving at very high speed. The magnetosphere and atmosphere block (solar) energetic particles (SEP) from reaching humans on Earth but they are damaging to the electronics of space-borne technology (such as satellites) and pose a radiation hazard to life in space and aircraft traveling at high altitudes.
IRDR
Geomagnetic storm
Subtype
A type of extra-terrestrial hazard caused by solar wind shockwaves that temporarily disturb the Earth’s magnetosphere. Geomagnetic storms can disrupt power grids, spacecraft operations, and satellite communications.
IRDR
Shockwave
Subtype
A shockwave carries energy from a disturbance through a medium (solid, liquid, or gas) similar to the action of a wave, though it travels at much higher speed. It can be a type of extra-terrestrial hazard caused by the explosion (airburst) or impact of meteorites that generate energy shockwaves capable of shattering glass, collapsing walls, etc.
IRDR
Radio disturbance
Subtype
Triggered by x-ray emissions from the Sun hitting the Earth’s atmosphere and causing disturbances in the ionosphere such as jamming of high and/or low frequency radio signals. This affects satellite radio communication and Global Positioning Systems (GPS).
IRDR
The “Collision” definition is derived from the IRDR “Impact” and “Airburst” definitions. ↩︎
3.5.4 - Geophysical Hazards
Term
Level
Definition
Source
Geophysical hazard
Subgroup
A hazard originating from solid earth. This term is used interchangeably with the term geological hazard.
IRDR
Earthquake
Type
Sudden movement of a block of the Earth’s crust along a geological fault and associated ground shaking.
IRDR
Ground movement
Subtype
Surface displacement of earthen materials due to ground shaking triggered by earthquakes or volcanic eruptions.
IRDR
Tsunami
Subtype
A series of waves (with long wavelengths when traveling across the deep ocean) that are generated by a displacement of massive amounts of water through underwater earthquakes, volcanic eruptions, or landslides. Tsunami waves travel at very high speed across the ocean, but as they begin to reach shallow water they slow down, and the wave grows steeper.
IRDR
Mass movement (dry)
Type
Any type of downslope movement of earth materials under hydrological dry conditions.
A large mass of loosened earth material, snow, or ice that slides, flows, or falls rapidly down a mountainside under the force of gravity. Debris Avalanche: The sudden and very rapid downslope movement of a mixed mass of rock and soil. There are two general types of debris avalanches. A cold debris avalanche usually results from an unstable slope suddenly collapsing whereas a hot debris avalanche results from volcanic activity leading to slope instability and collapse.
IRDR
Landslide (dry)
Subtype
Any kind of moderate to rapid soil movement incl. lahars, mudslides, and debris flows (under dry conditions). A landslide is the movement of soil or rock controlled by gravity and the speed of the movement usually ranges between slow and rapid, but it is not very slow. It can be superficial or deep, but the materials must make up a mass that is a portion of the slope or the slope itself. The movement has to be downward and outward with a free face.
EM-DAT
Rockfall (dry)
Subtype
Sudden subsidence (dry)
Subtype
Sinking of the ground due to groundwater removal, mining, dissolution of limestone (e.g., karst sinkholes), extraction of natural gas, and earthquakes. In this case, the sinking occurs under dry conditions as a result of a geophysical trigger.
A type of volcanic event near an opening/vent in the Earth’s surface including volcanic eruptions of lava, ash, hot vapor, gas, and pyroclastic material.
IRDR
Ash fall
Subtype
Fine (less than 4 mm in diameter) unconsolidated volcanic debris blown into the atmosphere during an eruption; can remain airborne for long periods of time and travel a considerable distance from the source.
IRDR
Lava flow
Subtype
The ejected magma that moves as a liquid mass downslope from a volcano during an eruption.
IRDR
Pyroclastic flow
Subtype
Extremely hot gases, ash, and other materials with a temperature of more than 1,000 degrees Celsius that rapidly flow down the flank of a volcano (at more than 700 km/h) during an eruption.
IRDR
Lahar
Subtype
Hot or cold mixture of earthen material flowing down the slope of a volcano either during or between volcanic eruptions.
IRDR
The definition of “Mass movement (dry)” is adapted from the “Mass movement” IRDR definition. ↩︎
The first definition sentence of “Sudden subsidence (dry)” is the definition of “Subsidence” in the IRDR glossary. The second sentence has been added to distinguish this class from “Sudden subsidence (wet)” in the hydrological group. ↩︎
3.5.5 - Hydrological Hazards
Term
Level
Definition
Source
Hydrological hazard
Subgroup
A hazard caused by the occurrence, movement, and distribution of surface and subsurface freshwater and saltwater.
IRDR
Flood
Type Subtype (General)
A general term for the overflow of water from a stream channel onto normally dry land in the floodplain (riverine flooding), higher-than-normal levels along the coast (coastal flooding) and in lakes or reservoirs as well as ponding of water at or near the point where the rain fell (flash floods).
IRDR
Coastal flood
Subtype
Higher-than-normal water levels along the coast caused by tidal changes or thunderstorms that result in flooding, which can last from days to weeks.
IRDR
Flash flood
Subtype
Heavy or excessive rainfall in a short period of time that produces immediate runoff, creating flooding conditions within minutes or a few hours during or after the rainfall.
IRDR
Riverine flood
Subtype
A type of flooding resulting from the overflow of water from a stream or river channel onto normally dry land in the floodplain adjacent to the channel.
IRDR
Ice jam flood
Subtype
The accumulation of floating ice restricting or blocking a river’s flow and drainage. Ice jams tend to develop near river bends and obstructions (e.g., bridges).
IRDR
Mass movement (wet)
Type
Types of mass movement that occur when heavy rain or rapid snow/ice melt send large amounts of vegetation, mud, or rock down a slope driven by gravitational forces.
A large mass of loosened earth material, snow, or ice that slides, flows, or falls rapidly down a mountainside under the force of gravity. Snow Avalanche: Rapid downslope movement of a mix of snow and ice.
IRDR
Landslide (wet)
Subtype
Any kind of moderate to rapid soil movement incl. lahars, mudslides, and debris flows (under wet conditions). A landslide is the movement of soil or rock controlled by gravity and the speed of the movement usually ranges between slow and rapid, but it is not very slow. It can be superficial or deep, but the materials must make up a mass that is a portion of the slope or the slope itself. The movement has to be downward and outward with a free face.
EM-DAT
Rockfall (wet)
Subtype
Sudden subsidence (wet)
Sinking of the ground due to groundwater removal, mining, dissolution of limestone (e.g., karst sinkholes), extraction of natural gas, and earthquakes. In this case, the sinking occurs under wet conditions as a result of a hydrological trigger (e.g., rain).
Wind-generated surface waves that can occur on the surface of any open body of water such as oceans, rivers, or lakes. The size of the wave depends on the strength of the wind and the distance traveled (fetch).
IRDR
Rogue wave
Subtype
An unusual single crest of an ocean wave far out at sea that is much higher and/or steeper than other waves in the prevailing swell system.
IRDR
Seiche
Subtype
A standing wave of water in a large semi- or fully-enclosed body of water (lakes or bays) created by strong winds and/or a large barometric pressure gradient.
IRDR
The “Mass movement (wet)” definition is adapted from the IRDR definition of “Debris flow, mud flow, rock fall”. ↩︎
The first definition sentence of “Sudden subsidence (wet)” is the definition of “Subsidence” in the IRDR glossary. The second sentence has been added to distinguish this class from “Sudden subsidence (dry)” in the geophysical group. ↩︎
3.5.6 - Meteorological Hazards
Term
Level
Definition
Source
Meteorological hazard
Subgroup
A hazard caused by short-lived, micro- to meso-scale extreme weather and atmospheric conditions that last from minutes to days.
IRDR
Extreme temperature
Type
A general term for temperature variations above (extreme heat) or below (extreme cold) normal conditions.
IRDR
Cold wave
Subtype
A period of abnormally cold weather. Typically, a cold wave lasts for two or more days and may be aggravated by high winds. The exact temperature criteria for what constitutes a cold wave may vary by location.
EM-DAT
Heat wave
Subtype
A period of abnormally hot and/or unusually humid weather. Typically, a heat wave lasts for two or more days. The exact temperature criteria for what constitutes a heat wave may vary by location.
EM-DAT
Severe winter conditions
Subtype
Damage caused by snow and ice. Winter damage refers to damage to buildings, infrastructure, traffic (esp. navigation) inflicted by snow and ice in the form of snow pressure, freezing rain, frozen waterways etc.
EM-DAT
Fog
Type Subtype
Water droplets that are suspended in the air near the Earth’s surface. Fog is, in fact, simply a cloud that is in contact with the ground.
Widespread and usually fast-moving windstorms associated with a convection/convective storm. Derechos include downburst and straight-line winds. The damage from derechos is often confused with the damage from tornadoes.
IRDR
Hail
Subtype
Solid precipitation in the form of irregular pellets or balls of ice more than 5 mm in diameter.
IRDR
Lightning / Thunderstorms
Subtype
A high-voltage, visible electrical discharge produced by a thunderstorm and followed by the sound of thunder.
Strong winds carrying particles of sand aloft, but generally confined to less than 50 feet (15 m), especially common in arid and semi-arid environments. A dust storm is also characterized by strong winds but carries smaller particles of dust rather than sand over an extensive area.
IRDR
Storm surge
Subtype
An abnormal rise in sea level generated by a tropical cyclone or other intense types of storm.
IRDR
Tornado
Subtype
A violently rotating column of air that reaches the ground or open water (waterspout).
IRDR
Winter storm/Blizzard
Subtype
A low-pressure system in winter months with significant accumulations of snow, freezing rain, sleet, or ice. A blizzard is a severe snowstorm with winds exceeding 35 mph (56 km/h) for three or more hours, producing reduced visibility (less than 0.25 miles (400 m)).
IRDR
Extra-tropical storm
Subtype
A type of low-pressure cyclonic system in the middle and high latitudes (also called a mid-latitude cyclone) that primarily gets its energy from the horizontal temperature contrasts (fronts) in the atmosphere. When associated with cold fronts, extra-tropical cyclones may be particularly damaging (e.g., European winter/windstorm, or Nor’easter).
IRDR
Tropical cyclone
Subtype
A tropical cyclone originates over tropical or subtropical waters. It is characterized by a warm-core, non-frontal synoptic-scale cyclone with a low-pressure center, spiral rain bands and strong winds. Depending on their location, tropical cyclones are referred to as hurricanes (Atlantic, Northeast Pacific), typhoons (Northwest Pacific), or cyclones (South Pacific and Indian Ocean).
IRDR
Severe weather
Subtype
Note: the only “Fog” entry in EM-DAT is the Great London SMOG, 1952, which was also accompanied by air pollution. ↩︎
The “Lightning/Thunderstorm” definition corresponds to the definition of “Lightning” in the IRDR glossary. ↩︎
3.5.7 - Complex and Technological Hazards
Term
Level
Definition
Source
Complex disaster
Group Subgroup Type Subtype
Major famine situation for which drought was not the main causal factor. Removed from EM-DAT in September 2023.1
EM-DAT
Industrial accident
Subgroup Type Subtype (General)
Disaster type term used in EM-DAT to describe technological accidents of an industrial nature/involving industrial buildings (e.g. factories).
EM-DAT
Miscellaneous accident
Subgroup Type Subtype (General)
Disaster type term used in EM-DAT to describe technological accidents of a non-industrial or transport nature (e.g., involving houses).
EM-DAT
Chemical spill
Type Subtype
Accident release occurring during the production, transportation, or handling of hazardous chemical substances.
EM-DAT
Collapse (Industrial) (Miscellaneous)
Type Subtype
Accident involving the collapse of a building or structure. Can either involve industrial structures or domestic/non-industrial structures.
EM-DAT
Explosion (Industrial) (Miscellaneous)
Type Subtype
Explosions involving buildings or structures. Can involve industrial structures.
EM-DAT
Fire (Industrial) (Miscellaneous)
Type Subtype
Urban fire involving buildings or structures. Can involve industrial structures.
Poisoning of atmosphere or water courses due to industrial sources of contamination.
EM-DAT
Radiation
Type Subtype
Transport accident
Subgroup
Disaster type term used to describe technological transport accidents involving mechanized modes of transport. It comprises four disaster subtypes (i.e., Air, Water, Rail, and Road).
EM-DAT
Air
Type Subtype
Transport accidents involving airplanes, helicopters, airships, and balloons.
EM-DAT
Water
Type Subtype
Transport accidents involving sailing boats, ferries, cruise ships, and other vessels.
EM-DAT
Rail
Type Subtype
Transport accidents involving trains.
EM-DAT
Road
Type Subtype
Transport accidents involving motor vehicles on roads and tracks.
EM-DAT
EM-DAT substantial modifications and references to legacy data are available in the release note section. ↩︎
Urban fire is a former class that is now either described as “Fire (industrial)” or “Fire (miscellaneous).” ↩︎
3.6 - Hazard and Disaster Magnitude Units
Additional Information About the Hazard Extent
Some disaster types may have a reported magnitude in the Magnitude and Magnitude Scale columns of the EM-DAT Public Table. EM-DAT disaster magnitude scales vary depending on the disaster type. The table below specifies magnitude property and units for related disaster types.
Disaster Type
Magnitude property
Magnitude Unit or Scale
Earthquake
Size of the earthquake derived from its physical properties
As the magnitude column provides additional hazard-specific information, it is used to report the number of vaccinated people for epidemics. However, it may not be a good indicator of the magnitude of the epidemic, which is also captured by the health impact. ↩︎
3.7 - Impact Variables
What Type of Information Is Collected to Evaluate the Impact of a Disaster? How Is It Aggregated, Reported, or Adjusted?
3.7.1 - Human Impact Variables
People Affected and Death Toll
Five variables describe the human impact of disasters in the EM-DAT Public Table:
Human Impact Variables
Total Deaths, which includes reported deaths and missing people,
No. Injured,
No. Affected,
No. Homeless, and
Total Affected, which is the sum of No. Injured, No. Affected, and No. Homeless.
The reported total number of deaths (column Total Deaths) includes confirmed fatalities directly imputed to the disaster plus missing people whose whereabouts since the disaster are unknown and so they are presumed dead based on official figures.
Aside from fatalities, the number of injured people (column No. Injured) is entered when the term “injured” is written in the source. Any related word like “hospitalized” is considered as injured. If no precise number is given, such as “hundreds of injured,” 200 injured will be entered (although this figure is probably an underestimate).
The number of affected people (column No. Affected) is often mentioned and is widely used by different actors to convey the extent, impact, or severity of a disaster in non-spatial terms. If only the number of families affected or houses damaged are reported, the figure is multiplied by the average family size for the affected area (×5 for developing countries, ×3 for industrialized countries, according to the UNDP country classification).
Calculation of `No. Affected` (Examples)
Number of houses damaged: 50 × 5 = 250 affected (although this figure is probably an underestimate).
If the value ranges from a minimum to a maximum: the average is taken.
Thousands affected: 2,000 affected (although this figure is probably an underestimate).
Similarly, the indicator No. Homeless is mentioned whenever it is found in reports. If only the number of families that are homeless or houses that are destroyed are reported, the figure is multiplied by the average family size for the affected area (x5 for developing countries, x3 for industrialized countries, according to the UNDP country list).
Calculation of `No. Homeless` (Examples)
Number of houses destroyed: 50 × 5 = 250 homeless (although this figure is probably an underestimate).
If the value ranges from a minimum to a maximum: take the average.
Thousands homeless: 2,000 homeless (although this figure is probably an underestimate).
Finally, the indicator Total Affected is the total of injured, affected, and homeless people. For each disaster and its corresponding sources, the population referred to in these statistics and the apportionment between injured, affected, homeless, and the total is carefully checked by CRED staff members.
Human Impact and Conceptual Uncertainties
The terms “dead,” “injured,” and “homeless” are more straightforward than “affected persons.” The definition of “affected persons” varies across sources and lacks a universal standard. Besides, for disasters such as droughts or heatwaves, which have ambiguous spatiotemporal boundaries, determining the number of casualties can be challenging. CRED directly uses numbers in EM-DAT as they appear in original sources, even if there are uncertainties in these figures. More details on these uncertainties can be found in the section on General Issues.
Usually, at least the field Total Deaths or Total Affected are found in EM-DAT records as these numbers are involved as entry criteria. However, records often contain incomplete impact statistics (see Accounting Biases).
3.7.2 - Economic Impact Variables
Total Economic Damage, Reconstruction Costs, and Insured Damage
Six variables describe the economic impact of disasters in the EM-DAT Public Table:
Economic Impact Variables
Reconstruction Costs ('000 US$),
Reconstruction Costs, Adjusted ('000 US$),
Insured Damage ('000 US$),
Insured Damage, Adjusted ('000 US$),
Total Damage ('000 US$), and
Total Damage, Adjusted ('000 US$).
These six statistics are the three same statistics (Reconstruction Costs ('000 US$), Insured Damage ('000 US$), and Total Damage ('000 US$)) repeated to also provide an amount corrected for inflation, i.e., “Adjusted” (See Economic Adjustment). Damage and costs are converted and expressed in thousands of US dollars (‘000 US$).
Underreporting of Economic Losses
Economic damage resulting from disasters is largely underreported. In EM-DAT, figures tend to be available only for high-impact disasters in countries with insurance and reinsurance coverage. This issue is described in the Specific Biases section, in particular, in the Accounting Biases section.
Reconstruction costs are different from total damages as they must consider the current construction or purchase costs of goods, as well as the additional cost of prevention and mitigation measures designed to reduce damage from future disasters. Hence, when reconstruction costs are specified, they are usually greater than the total damage.
Insured damage is usually reported by reinsurance companies that publish figures about disaster losses, e.g., MunichRe, SwissRe, or AON. When insured damage is reported, the total damage is generally reported from the same source for consistency.
3.8 - Spatial Information and Geocoding
Standards for Administrative Regions
Country Codes (ISO-3)
In the EM-DAT Public Table, the ISO column indicates a 3-letter (alpha-3) code representing a specific country, e.g., “BEL” for Belgium. This code is presented according to the international standard ISO-3166 determined by the International Organization for Standardization (ISO). Due to historical changes in the countries’ denomination or boundaries, you may find country codes that are not found in the current ISO 3166 alpha-3 country codes. These extensions are listed in the table below.
Disclaimer
The extensions to the ISO 3166-1 alpha-3 norm are the results of historical changes in the norms used. Please note that CRED aims to deliver data within an accurate spatiotemporal context. The way the EM-DAT data is presented and documented on this website does not reflect any geopolitical views held by the CRED, or the views of our partners, including the United States Agency for International Development or the United States Government.
Country codes are particularly useful to link the EM-DAT tabular data to a spatial layer using a Geographic Information System (GIS), spatial database, or geoprocessing programming library.
United Nations M49 Standard Country or Area Codes
The UN M49, also known as the Standard Country or Area Codes for Statistical Use (Series M, No. 49), is a set of area codes formulated by the United Nations for data analytics. This standard is curated and upheld by the United Nations Statistics Division. The UN M49 alpha-3 codes largely overlaps with the ISO-3166 alpha-3 norm.
From September 2023 onward, the EM-DAT Public Table refers to the Country, Region, and Subregion names as found in the UN M49 standard. Codes used for the EM-DAT extensions to the ISO alpha-3 codes and UNM49 are listed in the table below.
Alpha-3 Code
Country Name
Region
Subregion
ANT
Netherlands Antilles
Americas
Latin America and the Caribbean
AZO
Azores Islands
Europe
Southern Europe
CHA
Channel Islands
Europe
Western Europe
CSK
Czechoslovakia
Czechoslovakia
Eastern Europe
DDR
German Democratic Republic
Europe
Western Europe
DFR
Germany Federal Republic
Europe
Western Europe
SCG
Serbia Montenegro
Europe
Southern Europe
SPI
Canary Islands
Africa
Northern Africa
SUN
Soviet Union
Europe
Eastern Europe
YMD
People’s Democratic Republic of Yemen
Asia
Western Asia
YMN
Yemen Arab Republic
Asia
Western Asia
YUG
Yugoslavia
Europe
Southern Europe
TWN
Taiwan (Province of China)
Asia
Eastern Asia
GAUL Index and Admin Levels
Since 2014, EM-DAT has relied on the Global Administrative Unit Layers (GAUL) implemented by the Food and Agriculture Organization (FAO). EM-DAT provides loss statistics at the country level, which corresponds to GAUL Admin-0 level. In addition, the EM-DAT Public Table mentions in the Admin Units column which region is affected by the disaster up to the Admin-2 level (e.g., districts). The mapping of EM-DAT disaster events at this higher level of geographical precision has only been completed for data since 2000. Nevertheless, the Admin-0 human and economic impact variables at the country level are not disaggregated between regions at the Admin-1 or Admin-2 level. Hence, only the occurrence is available at a more precise administrative level, and the impact variables remain representative of the country level.
GAUL Maintenance
Since 1990, GAUL has provided the most reliable spatial information on Administrative Units for all countries in the world down to the second administrative level (e.g., districts). However, it has no longer been maintained since its last version was released in 2015. In the future, EM-DAT may depend on alternative datasets such as the GADM Database of Global Administrative Areas.
For disaster loss dataset mapping EM-DAT with GADM, you may refer to:
The EM-DAT database is compiled from various sources, including United Nations, governmental and non-governmental agencies, insurance companies, research institutes, and the press. As of September 2023, the most common sources are included in the table below. For futher inquiries on the data collection and selection process, see EM-DAT Protocols.
Source name
Category
Type of disasters covered
Office for the Coordination of Humanitarian Affairs (OCHA) / ReliefWeb
Minimal Requirements for a Disaster To Be Entered in EM-DAT
The EM-DAT definition of a disaster considers unintended hazards with a substantial impact unforeseen by a community (see General Definitions and Concepts). For management and operational purposes, EM-DAT has a set of entry criteria that specify what substantial impact means. EM-DAT disaster records related to natural and technological hazards meet at least one of the following inclusion criteria:
EM-DAT Inclusion Criteria
At least ten deaths (including dead and missing).
At least 100 affected (people affected, injured, or homeless).
A call for international assistance or an emergency declaration.
There are, however, secondary criteria, especially for past events where quantitative data were not available (e.g., “the worst disaster in a country or region” or “an event that resulted in considerable damage”).
4.2 - Encoding, Quality Control, and Validation Procedure
How EM-DAT Data Is Encoded and Controlled?
Source identification and collection can be facilitated and partially automated thanks to online services offered by specific sources (e.g., email alert systems, news feeds, or APIs). However, data collection and encoding are always supervised manually by the database manager. The database manager controls the sources that are selected, the classification of the event, its spatiotemporal delimitation, and the identification of the impact figures. Data encoding and validation in EM-DAT is a three-step process:
The database manager checks daily information using the preferred source list (see EM-DAT sources). Whenever a new disaster is identified based on a source, it is added to the database. In the first stage, the event is not made public. It becomes so when an entry criterion is met and confirmed by at least two sources. The figures remain subject to changes. Any publication or modification made on a public disaster entry will be visible to the user after the weekly update routine. This routine is usually executed on mondays but may be triggered by the manager if deemed necessary, e.g. in the case of faulty figures or typos.
The published impact variables could be selected from one or more sources. An event can therefore be validated from several sources of information. For example, the human impact can come from an OCHA report and the economic data from a reinsurance report, depending on specific expertise. If the figures differ between the sources, the database manager decides which ones to attribute to the disaster. The choice depends on several elements: the figure itself and the area and period to which it refers, the sources’ chronology, and its degree of reliability. Because this task is complex and case-dependent, there is no pre-determined rule for selecting figures, and the database manager makes the final choice. Some examples of general, however, not systematic, decision rules are illustrated in the box below.
Informal Rules used to Prioritize Sources and Select Loss Statistics
Sources offering loss statistics on a broader spatial and temporal scale are preferred to sources providing figures for a restricted locality and time frame. For example, a national report is prioritized over a news brief reporting the losses for a specific day in a local district.
The latest and more mature sources are preferred to earlier ones as they are likely to better reflect the aftermath of the disaster.
Sources from research institutes, governmental organizations, or humanitarian NGOs are preferred to those from the press and early emergency alerting systems as their figures are assumed to be more accurate.
The rules here are only informal and the database manager may disregard them. For example, suppose a report mentions 200 deaths and a news article says, “regional authorities estimate the death toll now stands at 243 dead and missing”. Although this is a newspaper article, the precision of the statement suggests that this figure is more reliable than the one in the official report.
Quality Control and Annual Validation
Quality control and annual validation are systematic checks of all the entries starting in a specific year. It typically takes place at the beginning of the following year. During this validation, all the disasters that took place in the previous year are reviewed to consolidate the data, identify possible additional sources, and modify the published figures accordingly. In addition, the georeferencing, i.e., the more precise attribution of the disaster to GAUL level 1 or 2 zones, is also finalized during the annual validation period (see GAUL Index and Admin Levels).
Thematic Reviews
The CRED periodically conducts thematic reviews of disasters to mitigate the database’s weaknesses (see Known Issues). This task involves systematically checking entries for a type of disaster over a given period or region. The revision can be a data analysis for further quality control, a systematic review of the scientific literature, or a comparison with other existing databases.
From September 2023 onward, these substantial database content updates are planned to be notified on the EM-DAT website and in the documentation release notes for tracking purposes (see Introduction). The Entry Date and Last Update column have also been introduced in the EM-DAT Public Table.
Automated Procedures and Constraints
In 2023, the constraints of the EM-DAT database have been strengthened. These constraints define the domain of values that can be encoded and, if correctly set, can prevent encoding errors in the value or its format. In addition, there are automated procedure checks for anomalies that are likely to be an error, i.e., those without enough certainty to be a constraint but with sufficient likelihood to be notified to the database manager for verification.
Currently, constraints and automated routines check for the consistency of date and time fields, latitude and longitude values, and hazard magnitude values. These procedures are implemented incrementally each time an error that could be prevented is discovered. Hence, by detecting and reporting issues, users may contribute to developing these routines and improving EM-DAT data quality.
Issue Reporting
The CRED encourages any external initiative that can help us improve our data quality. Any problem with the data content (such as errors, or missing data) can be reported to CRED by email using the contact address (see Send Us an Email). For missing entries, you should be aware that the CRED only publishes disasters for which reliable figures are available and when these are corroborated by at least two sources (see Daily Encoding). The CRED reserves the right to modify the data according to subsequent notifications. For issues concerning specific disaster events, the problem should be explained and notified with a list including the related DisNo. values (see Column Description).
For less specific issues, users who have analyzed the quality of EM-DAT are encouraged to share their reports or scientific studies with the EM-DAT team to improve the database (see Contributing).
4.3 - Economic Adjustment
How are Economic Impact Variables Converted and Adjusted for Inflation?
All economic damage in EM-DAT is expressed in thousands of US$ (see Column Description and Economic Impact Variables). For each disaster, the registered figure corresponds to value of the damage at the moment of the event. If a source reports damage in another currency, it is first converted to US$ before it is entered in EM-DAT using a converter (see this example), at the exchange rate when the damage occurred.
The adjusted economic losses in EM-DAT provide a monetary value in US$ that has been adjusted for inflation (see Column Description). The adjustment is linearly proportional to the OECD Consumer Price Index (CPI) provided by the Organization for Economic Cooperation and Development (OECD). The CPI reflects the change in prices of a basket of goods and services that are typically purchased by specific groups of households. EM-DAT relies on the total CPI, i.e., including both food and energy products in the basket, defined for the USA.
In practice, OECD provides the US CPI with 2015 as the base year (\(CPI_{2015}=100\), see Consumer prices for G20 ). In EM-DAT, the CPI is rescaled to use the last year as a reference, e.g., \(CPI_{2021}=100\). The rescaling is performed when the OECD CPI value becomes available. The economic losses given for the current year are therefore not adjusted and not reported in the column Total Damages, Adjusted ('000 US$).
How to Compute an Adjusted Economic Impact
For a given year \(Y\) and its rescaled CPI value \(CPI_y\), a monetary loss \(X\) is adjusted into a year-specific \(X_{adj}\) based on the formula:
*2021 is here given as an example. In the EM-DAT Public Table, the annual CPI values are adapted and rescaled from OECD values to ensure that we have the latest year available at the 100 value. This does not affect the end result as the CPI ratio between years is conserved.
Examples
For instance, on December 25, 2022, a disaster entry that occurred in 2021 would have a CPI value of 100. A disaster that has occurred in 2022 will not have a CPI value; hence, no economic losses will be mentioned in the Total Damages, Adjusted ('000 US$) column.
If a disaster has an economic loss of 1 million US$ in 2019 with a rescaled CPI value of 93, the adjusted damage would be 100×1,000,000/93=1,075,000 US$.
5 - Known Issues and Limitations
What Difficulties May Be Encountered While Interpreting EM-DAT Data?
EM-DAT is the only comprehensive, free-access disaster loss database with effective global coverage1. However, it has limitations due to the limited number of sources and limitations related to how effectively disasters are reported worldwide. This can lead to biases in the data over which CRED may have limited control, and that could be overlooked in the literature2. Nevertheless, EM-DAT remains a key resource for understanding disaster events and impacts. No current impact database is completely accurate. The United Nations emphasizes the importance of global improvements in documenting disasters in global agendas such as the SENDAI Framework for Disaster Risk Reduction (SFDRR).
Understanding the limitation of a dataset such as EM-DAT is of paramount importance for those who wish to adequately use the data and mitigate its weaknesses for the following purposes: disaster risk management, emergency planning, scientific research, and raising public awareness.
Mazhin, S. A., Farrokhi, M., Noroozi, M., Roudini, J., Hosseini, S. A., Motlagh, M. E., Kolivand, P., and Khankeh, H.: Worldwide disaster loss and damage databases: A systematic review, J Educ Health Promot, 10, 329, https://doi.org/10.4103/jehp.jehp_1525_20, 2021. ↩︎
Jones, R. L., Kharb, A., and Tubeuf, S.: The untold story of missing data in disaster research: a systematic review of the empirical literature utilising the Emergency Events Database (EM-DAT), Environ. Res. Lett., 18, 103006, https://doi.org/10.1088/1748-9326/acfd42, 2023. ↩︎
5.1 - General Issues
Understanding Broad Data Quality Concerns in EM-DAT
Three types of data quality issues can be considered:
Types of Data Quality Issues
Disaster events that are missing in EM-DAT.
Disaster events that exist but that have missing values, e.g., for the impact variables.
Disaster events that are well documented but with attributes that are inaccurate or differ from other sources.
A cross-comparison of EM-DAT with a local database and/or a disaster-specific database can help identifiy Issue 1 (e.g., Koç & Thieken, 20181; Lin et al., 20212). For an account of missing values for existing events, we refer to Jones et al. 20213 and the section on Accounting Biases. Issue 3 is partially related to the data collection sources, protocols, or reporting systems generally used by different databases.
Data quality issues within EM-DAT are related to the data collection protocols from dedicated sources. EM-DAT’s completeness reflects the coverage of its sources. Since source reporting has improved over the years, EM-DAT data coverage has improved significantly over the last 30 to 40 years. Nevertheless, gaps and quality issues remain. EM-DAT protocols are meant to guide the way information is monitored and collected from sources. However, no universally applied protocol ensures that different sources report disaster impact and losses using the same guidelines to define, for instance:
the beginning and end of disaster events.
the geographical footprint of a disaster.
impact variables such as deaths (in particular, when computed based on excess mortality), affected people, or economic costs.
the disaster type selected by the sources.
Some references illustrate the issues and challenges related to collecting and maintaining a disaster database, e.g., Guha-Sapir & Misson 19924, Kron et al. 20125, and Wirtz et al. 20146.
To some extent, EM-DAT owes its popularity to its simplicity. It reports disaster events as rows in an Excel table. However, this simplicity comes at the cost of conceptual limitations in dealing with complex and compound events and situations. In such cases, as exemplified in the box below, EM-DAT will probably report the disaster in the same way as the source which presented it. The EM-DAT database manager can only choose to select some numbers over some others (see Daily Encoding). However, no model is involved in correcting differences in reporting protocols because this task goes beyond the information monitoring conducted at the CRED by the EM-DAT team.
Fictive Example of Disaster Complexity
If a source reports a heatwave with a certain number of deaths, EM-DAT is likely to record it as such.
If the same heatwave hits a neighboring country, whose institutions have different reporting protocols, EM-DAT will also report the disaster entry based on the source’s numbers.
Since the protocols are different, this will create a systemic bias in EM-DAT.
The event duration may be misaligned; some may have accounted for co-occurring effects, such as droughts, wildfires, and air pollution, in the estimation of the loss statistics (e.g., deaths, affected people, or costs).
In some cases, the main type could even be different. In databases other than EM-DAT, the event and the numbers may also have another representation.
Such biases that result from differences in the impact reporting systems were generally referred to by Gall et al. 20097 as systemic biases. Some studies point to systemic biases by highlighting that EM-DAT does not correlate well with other databases (e.g., Moriyama et al., 20188; Panwar & Sen, 20209). In their article, Gall et al. 20097 cover four other types of biases: time, hazard-related, spatial, and accounting biases. These are illustrated in the next sections.
Koç, G., and Annegret H. T. “The Relevance of Flood Hazards and Impacts in Turkey: What Can Be Learned from Different Disaster Loss Databases?” Natural Hazards 91, No. 1 (2018): 375408. https://doi.org/10.1007/s11069-017-3134-6. ↩︎
Lin, Y. C., Khan, F., Jenkins, S. F. and Lallemant, D. “Filling the Disaster Data Gap: Lessons from Cataloging Singapore’s Past Disasters.” Int. J. Disaster Risk Sci. 12, 188–204 (2021). https://doi.org/10.1007%2Fs13753-021-00331-z. ↩︎
Jones, R. L., Guha-Sapir, D., and Tubeuf, S.: “Human and economic impacts of natural disasters: can we trust the global data?”, Sci Data, 9, 572 (2022). https://doi.org/10.1038/s41597-022-01667-x. ↩︎
Kron, W., Steuer, M., Löw, P., and Wirtz, A. “How to Deal Properly with a Natural Catastrophe Database – Analysis of Flood Losses.” Natural Hazards and Earth System Sciences 12, No. 3,53550 (2012). https://doi.org/10.5194/nhess-12-535-2012. ↩︎
Wirtz, A., Kron, W., Löw, P., and Steuer, M. “The Need for Data: Natural Disasters and the Challenges of Database Management”. Natural Hazards 70, No. 1, 13557 (2014). https://doi.org/10.1007/s11069-012-0312-4. ↩︎
Gall, M., Kevin A. B., and Susan L. C. “When Do Losses Count?: Six Fallacies of Natural Hazards Loss Data.” Bulletin of the American Meteorological Society 90, No. 6,799810 (2009). https://doi.org/10.1175/2008BAMS2721.1. ↩︎↩︎
Moriyama, K., Daisuke S., and Yuichi O. “Comparison of Global Databases for Disaster Loss and Damage Data.” Journal of Disaster Research 13, No. 6, 100714 (2018). https://doi.org/10.20965/jdr.2018.p1007. ↩︎
Panwar, V. and Subir S. “Disaster Damage Records of EM-DAT and DesInventar: A Systematic Comparison.” Economics of Disasters and Climate Change 4, No. 2, 295317 (2020). https://doi.org/10.1007/s41885-019-00052-0. ↩︎
5.2 - Specific Biases
Understanding Particular Data Quality Concerns in EM-DAT
Time Bias
Time biases result from unequal reporting quality and coverage over time1. The figure below shows the occurrence of disasters in EM-DAT. The figure shows a significant increase that starts in the 1960s. This increase coincides with the creation of OFDA. In 1973, OFDA started compiling disaster data, and the CRED was created2. In 1988, the CRED took over the disaster database and created EM-DAT. In the meantime, communication technologies have improved, with the first personal computers and satellites appearing in the 1970s and the advent of the World Wide Web in the 1990s (see also History of EM-DAT)
Technologies and initiatives can be considered responsible for the dominant trend observed. Therefore, it is challenging to infer insight into the actual drivers of disasters such as climate change, population growth, or disaster risk management3. Accordingly, excluding pre-2000 data from trend analyses based on EM-DAT is strongly recommended. From September 2023 onward, the CRED refers to pre-2000 data as Historic data in the EM-DAT Public Table.
Hazard-related Biases
Hazard-related biases result from unequal reporting quality and coverage for different hazard types1. For example, in EM-DAT, data related to biological hazards (e.g., epidemics) and extreme temperature hazards (e.g., heat waves) are less covered and the cover of lower quality. Some hazard-related biases are illustrated in the Accounting Biases and Geographic Biases sections.
Threshold Biases
Threshold biases result from unequal reporting quality and coverage for disasters of different magnitudes1. High-impact disasters attract more attention, resulting in better media coverage and reporting. This could lead to threshold biases in EM-DAT. The EM-DAT entry criteria introduce a kind of threshold bias, as shown in the figure below regarding disaster mortality, while some studies have shown locally that small disasters may have a high cumulative impact, e.g.4. Regarding disasters that fit EM-DAT’s entry criteria, it is fair to assume that disasters close to the entry criteria are more likely to be missing than high-impact disasters. However, as shown in the figure below, the cumulative mortality associated with low-mortality events exceeds the cumulative impact of higher-mortality events.
Accounting Biases
Accounting biases result from unequal reporting quality and coverage for different impact variables1. For instance, in EM-DAT, the economic losses are, on average, less frequently reported than the human impact variables, which may also depend on the hazard type (see the figure below). Furthermore, insured damages are naturally more reported than uninsured damages, which creates a geographic bias where there is a lack of insurance coverage, as in Africa. For droughts, EM-DAT fails to capture the associated mortality because it is overlooked as an indirect impact, as evidenced by the UNDRR 2021 Global Assessment Report on Droughts.
Besides, it cannot be assumed that because an impact is reported in EM-DAT, there is no accounting bias. In general, direct impacts are often reported by EM-DAT sources, while indirect impact estimates are less available. For instance, indirect deaths for a flood event correspond to the number of fatalities occurring during the event, while indirect deaths result from disease outbreaks due to deteriorated sanitary conditions. Yet, indirect mortality is sometimes more important than direct mortality, for examples.5
Geographic Biases
Geographic biases result from unequal reporting quality and coverage across space1. In general, EM-DAT has a relatively worse coverage for Sub-Saharan Africa regarding the occurrence and the accounting of impact variables6. Any disaster type may be subject to geographic biases in EM-DAT as there may be discrepancies between reporting systems from one country to another (see General Issues).
This issue is particularly pronounced regarding heat waves7, as shown in the figure below.
Heat waves are often overlooked in Sub-Saharan Africa8. About 52% of heatwave events in EM-DAT occurred in nine countries: Japan, India, Pakistan, the USA, followed by Western European countries (France, Belgium, United Kingdom, Spain, and Germany).
References
Gall, M., Kevin A. B., and Susan L. C. “When Do Losses Count?: Six Fallacies of Natural Hazards Loss Data.” Bulletin of the American Meteorological Society 90, No. 6,799810 (2009). https://doi.org/10.1175/2008BAMS2721.1. ↩︎↩︎↩︎↩︎↩︎
CRED “Happy Birthday, CRED: Celebrating 50 Years of Disaster Epidemiological Research, Data Collection, and International Cooperation”, Centre for Research on the Epidemiology of Disasters (CRED), Brussels, Belgium, CRED Crunch No. 71 (2023), https://www.cred.be/sites/default/files/CredCrunch71.pdf. ↩︎
Marulanda, M. C., Cardona, O. D., and Barbat, A. H. “Revealing the socioeconomic impact of small disasters in Colombia using the DesInventar database”, Disasters, 34, 552–570 (2010), https://doi.org/10.1111/j.1467-7717.2009.01143.x↩︎
Osuteye, E., Johnson, C., and Brown, D. “The data gap: An analysis of data availability on disaster losses in sub-Saharan African cities”, International Journal of Disaster Risk Reduction, 26, 24–33 (2017), https://doi.org/10.1016/j.ijdrr.2017.09.026. ↩︎
Brimicombe, C., Di Napoli, C., Cornforth, R., Pappenberger, F., Petty, C., and Cloke, H. L. “Borderless Heat Hazards With Bordered Impacts”, Earth’s Future, 9, e2021EF002064 (2021), https://doi.org/10.1029/2021EF002064. ↩︎
Harrington, L. J. and Otto, F. E. L. “Reconciling theory with the reality of African heatwaves”, Nat. Clim. Chang., 10, 796–798 (2020), https://doi.org/10.1038/s41558-020-0851-8. ↩︎
6 - Additional Resources and Tutorials
External Resources and FAQ
6.1 - Tutorials
Handle, Describe, and Plot the EM-DAT Data
6.1.1 - Python Tutorial 1: Basic Operations and Plotting
This tutorial shows basic examples on how to load, handle, and plot the EM-DAT data using the pandas Python data analysis package and the matplotlib charting library.
Let us import the necessary modules and print their versions. For this tutorial, we used pandas v.2.1.1 and matplotlib v.3.8.3. If your package versions are different, you may have to adapt this tutorial by checking the corresponding package documentation.
importpandasaspd#data analysis packageimportmatplotlibasmplimportmatplotlib.pyplotasplt#plotting libraryfor i in [pd, mpl]:
print(i.__name__, i.__version__)
Use the pd.read_excel method to load and parse the data into a pd.DataFrame object;
Check if the data has been successfully parsed with the pd.DataFrame.info method.
Notes:
You may need to install the openpyxl package or another engine to make it possible to read the data.
Another option is to export the .xlsx file into a .csv, and use the pd.read_csv method;
If not in the same folder as the Python code, replace the filename with the relative path or the full path, e.g., E:/MyDATa/public_emdat_2024-01-08.xlsx
#!pip install openpyxldf = pd.read_excel('public_emdat_2024-01-08.xlsx') # <-- modify file name or pathdf.info()
Let us focus on the EM-DAT earthquakes in Japan from the years 2000 to 2003 and create a suitable filter utilizing the EM-DAT columns Disaster Type, ISO and Start Year.
For simplicity, let’s retain only the columns Start Year, Magnitude, and Total Deaths and display the first five entries using the pd.DataFrame.head method.
Note:
For further details about the columns, we refer to the EM-DAT Documentation page EM-DAT Public Table.
Note: The count method provides the total number of non-missing values, while size gives the total number of elements (including missing values). Since the field Start Year is always defined, both methods should return the same results.
The pandas library relies on the matplotlib package to draw charts. To have more flexibility on the rendered chart, let us create the figure using the imported plt submodule.
# Group earthquake data by 'Start Year' and count occurrenceseq_cnt = eq_jpn.groupby(['Start Year']).size()
# Initialize plot with specified figure sizefig, ax = plt.subplots(figsize=(7, 2))
# Plot number of earthquakes per yearax.bar(eq_cnt.index, eq_cnt)
# Set axis labels and titleax.set_xlabel('Year')
ax.set_ylabel('N° of Earthquakes')
ax.set_yticks([0, 1, 2, 3]) # Define y-axis tick marksax.set_title('EM-DAT Earthquakes in Japan (2000-2023)')
Text(0.5, 1.0, 'EM-DAT Earthquake in Japan (2000-2023)')
Output plot
Example 2: Comparing Regions
Let us compare earthquake death toll by continents. As before, we filter the original dataframe df according to our specific needs, including the Region column.
Text(0.5, 1.0, 'EM-DAT Earthquake Deaths by Regions')
Output plot
Example 3: Multiple Grouping
At last, let us report the earthquake time series by continents. To avoid the creation of a ['Region', 'Start Year'] multiindex for future processing, we set the argument as_index to False. As such, Region and Start Year remain columns.
Text(0.5, 1.0, 'EM-DAT Earthquake Deaths by Regions')
Output plot
In order to be able to visualize the data in more details, let us make a subplot instead by setting the subplot argument to True within the plot method.
We have just covered the most common manipulations applied to a pandasDataFrame containing the EM-DAT data. To delve further into your analyses, we encourage you to continue your learning of pandas and matplotlib with the many resources available online, starting with the official documentation.
If you are interested in learning the basics of making maps based on EM-DAT data, you can also follow the second EM-DAT Python Tutorial.
6.1.2 - Python Tutorial 2: Making Maps
If you have followed the first EM-DAT Python Tutorial 1 or are already familiar with pandas and matplotlib, this second tutorial will show you basic examples on how to make maps with the EM-DAT data using the geopandas Python package.
Let us import the necessary modules and print their versions. For this tutorial, we used pandas v.2.1.1, geopandas v.0.14.3, and matplotlib v.3.8.3. If your package versions are different, you may have to adapt this tutorial by checking the corresponding package documentation.
importpandasaspd#data analysis packageimportgeopandasasgpdimportmatplotlibasmplimportmatplotlib.pyplotasplt#plotting libraryfor i in [pd, gpd, mpl]:
print(i.__name__, i.__version__)
pandas 2.2.1
geopandas 0.14.3
matplotlib 3.8.3
Creating a World Map
To create a world map, we need the EM-DAT data and a shapefile containing the country geometries.
EM-DAT: We download and load the EM-DAT data using pandas.
Country Shapefile: We download a country shapefile from Natural Earth Data. For a world map, we download the low resolution 1:110m Adimin 0 - Countries (last accessed: March 10, 2024) and unzip it.
Load and Filter EM-DAT
Let us load EM-DAT and filter it to make a global map of Earthquake disasters between 2000 and 2023. We calculate the number of unique identifiers (DisNo.) per country (ISO) We refer to the standard ISO column instead of the Country column of the EM-DAT Public Table to be able to make a join with the country shapefile.
We use the gpd.read_file method to load the country shapefile and parse it into a geodataframe. A geodataframe is similar to a pandas dataframe, extept that has a geometry column.
We provide the filename argument, which is either a file name if located in the same directory than the running script, or a relative or absolute path, if not. In our case the shapefile with the .shp extension is located in the ne_110m_admin_0_countries folder.
Since the geodataframe contains 169 columns, we only keep the two column that we are interrested in, i.e., ISO_A3 and geometry.
Important Notice: Above, some geometries do not have a ISO code, such as the one at row 174. Below, you will see that some ISO in EM-DAT are not matched with a geometries. Beyond this basic tutorial, we advice to carefully evaluate these correspondance and non-correspondance between ISO codes and to read the EM-DAT Documentation about ISO codes.
Join the Two Datasets
Let us merge the two dataset with an outer join, using the merge method. We prefer an outer join to keep the geometries of countries for which EM-DAT has no records.
To make the map, we use the geopandas built-in API, through the plot method built on the top of matplotlib.
Below, we show an hybrid plotting approach and first create an empty figure fig and ax object with matplotlib before passing the ax object as an argument within the plot method. This approach gives more control to users familiar with matplotlib to further customize the chart.
We can create a more detailed map using the Admin Units column in the EM-DAT Public Table. This column contains the identifiers of administrative units of level 1or 2 as defined by the Global Administrative Unit Layer (GAUL) for country impacted by non-biological natural hazards.
Similarly to the country map, we need to download a file containing GAUL geometries. The file corresponds to the last version of GAUL published in 2015. In this tutorial, we will focus on Japanese earthquake occurrence in EM-DAT.
Note: the file size is above 1.3Go and requires a performant computer to process in Python. Using a Geographical Information Software (GIS) for the preprocessing is another option.
Load the Admin Units Geopackage
The file is a geopackage .gpkg that contains multiple layers. Let us first describe these layers with the fiona package, which is a geopandas dependency.
importfionaprint(fiona.__name__, fiona.__version__)
for layername in fiona.listlayers('gaul2014_2015.gpkg'):
with fiona.open('gaul2014_2015.gpkg', layer=layername) as src:
print(layername, len(src))
fiona 1.9.5
level2 38258
level1 3422
level0 277
The level0 layer contains the country geometries defined in GAUL.
Here, we make a map at the level1.
Still, we need to load the administrative level2 because the Admin Units column may refer to Admin 2 levels without mentionning the corresponding Admin 1 level.
Given the high size the admin 2 layer, we filter the data about Japan and overwrite our geodataframe variable to save memory.
Note: The last two events were not geolocated at a higher administrative levels.
Convert Admin 2 units to Admin 1 units
We create a python function, json_to_amdmin1, to extract the administrative level 1 codes from the Admin Units column of EM-DAT, based on the ADM1_CODE and ADM2_CODE of the Japan geodataframe.
importjsondefjson_to_admin1(json_str, gdf):
"""
Convert a JSON string to a set of administrative level 1 codes.
Parameters
----------
json_str
A JSON string representing administrative areas, or None.
gdf
A GeoDataFrame containing administrative codes and their corresponding
levels.
Returns
-------
A set of administrative level 1 (ADM1) codes extracted from the input JSON.
Raises
------
ValueError
If the administrative code is missing from the input data or ADM2_CODE
not found in the provided GeoDataFrame.
""" adm_list = json.loads(json_str) ifisinstance(json_str, str) elseNone adm1_list = []
if adm_list isnotNone:
for entry in adm_list:
if'adm1_code'in entry.keys():
adm1_code = entry['adm1_code']
elif'adm2_code'in entry.keys():
gdf_sel = gdf[gdf['ADM2_CODE'] == entry['adm2_code']]
ifnot gdf_sel.empty:
adm1_code = gdf_sel.iloc[0]['ADM1_CODE']
else:
raiseValueError(
'ADM2_CODE not found in the provided GeoDataFrame.' )
else:
raiseValueError(
'Administrative code is missing from the provided data.' )
adm1_list.append(adm1_code)
returnset(adm1_list)
We apply the function to all elements of the Admin Units column.
The can be done applying the explode method on the new Admin_1 column. The method will add rows based on the number of Admin 1 we have in each set inside the Admin_1 column. Then the counting can be performed using the former groupby approach.
Since the Japan geodataframe contains the admin2 geometries, we could load the Admin 1 layer or simply dissolve the geometries based on the ADM1_CODE column. The geopandas package is equipped with the dissolve method.
We have just covered the basics on how to join the EM-DAT pandasDataFrame with a geopandasGeoDataFrame to make maps. To delve further into your analyses, we encourage you to continue your learning of geopandas, matplotlib, or, in particular, cartopy for more advanced map customization, with the many resources available online.
6.2 - External Resources
Softwares and Complementary Data
Note that these resources were not developed or are not maintained by the EM-DAT team.
Please, contact the corresponding authors if you have any questions.
Vizualisation Tools
EM-VIEW: A Streamlit Dashboard to explore and analyze the EM-DAT Public table. Also available as a GitHub repo for customization. Learn more from its initial announcement.
The CRED’s main focus is on studying the impact of disasters on populations and on ways to improve the effectiveness of disaster response and risk reduction. The CRED’s research includes collecting, analyzing, and disseminating data on disasters caused by natural and technological hazards, within the EM-DAT project, as well as data on conflicts and other humanitarian emergencies.
The CRED’s research findings are used to inform policy and practice in disaster management in Belgium and internationally. In addition to its research activities, the CRED provides training, consultancy, and technical support to governments, humanitarian organizations, and other stakeholders involved in disaster risk reduction and emergency response.
The Joint History of CRED and the EM-DAT International Disaster Database
In the 1970s, the approach to disaster management was predominantly reactive, emphasizing immediate rescue and relief operations. Recognizing the imperative for a more proactive, informed, and systematic approach to disaster management, Professor Michel Lechat (UCLouvain) established the Centre for Research on the Epidemiology of Disasters (CRED) in 1973. One of the primary challenges faced by the emerging field of disaster epidemiology was the absence of comprehensive global data. A holistic perspective on disasters was essential not only to solidify the foundations of this nascent scientific domain but also to ensure evidence-based disaster management strategies.
Happy 50th Birthday, CRED
If you are interested in the joint history of CRED and EM-DAT, read our CRED Crunch No.71 newsletter to learn more. This special edition released for CRED’s 50th birthday provides a comprehensive and contextual overview of the history of CRED and its flagship project EM-DAT.
In 1984, Debarati Guha-Sapir joined the UCLouvain CRED team and collaborated with Prof. Lechat to initiate the development of the EM-DAT database. This endeavor built upon the foundational efforts of a prior database project spearheaded by the United States Agency for International Development/Office of Foreign Disaster Assistance (USAID/OFDA). The CRED then embarked on the meticulous task of data aggregation from diverse sources, including UN agencies, non-governmental organizations, and media outlets. The CRED has been managing the EM-DAT database since 1988. After Lechat, Prof. Guha-Sapir assumed the directorship of CRED in 1992, a role she held until 2021 when Prof. Niko Speybroeck took on the role of director.
Thanks to the support of USAID, EM-DAT has evolved into a public database and became an valuable unique resource for disaster research and management.
7.2 - EM-DAT Partners
USAID Bureau for Humanitarian Assistance (USAID/BHA)
The Bureau for Humanitarian Assistance (BHA) is part of the US Agency for International Development (USAID). BHA is responsible for coordinating and providing humanitarian assistance to people affected by disasters and crises around the world. BHA was formerly known as the Office of US Foreign Disaster Assistance (OFDA) until it was rebranded in 2020.
BHA works in collaboration with other US government agencies, non-governmental organizations, and international partners to deliver aid to those in need. The agency responds to a range of emergencies, including disasters, conflicts, and disease outbreaks, and provides various form of assistance, such as food, shelter, medical care, and water and sanitation services. BHA also works to build the capacity of communities and local organizations to better prepare for and respond to emergencies in the future. Since 1999, USAID/BHA has supported the EM-DAT project.
Scientific & Technological Advisory Group (STAG)
Inaugurated in March 2023, the first Scientific & Technological Advisory Group (STAG) meeting took place in Brussels. The STAG takes over from other previously organized meetings called Technical Advisory Group (TAG) meetings. Technical Advisory Group (TAG) Meetings have been implemented every two years on average as part of the evaluation of the USAID-BHA/CRED initiative related to the EM-DAT international disaster database. The objective of the TAG meetings was to discuss and share with the TAG members different aspects related to the EM-DAT initiative and development. Those meetings produce a series of recommendations for the continuous improvement of the EM-DAT database and its related proposed services.
In 2023, the first STAG meeting also included experts from the scientific community. The STAG included participants from several national, international, and UN public agencies, humanitarian agencies, research centers, and universities. The group was composed in such a way as to bring together expertise on various types of disasters and profiles with different skills and interests, from research to field actors to public institutions.
For more details and documents on the TAG and STAG meeting, please visit our dedicated web page.
7.3 - Ways to Contribute
Contributing
CRED regularly collaborates with researchers and institutions to improve the quality and use of disaster impact data. You can help us in various ways:
By sending us the results of your work if it could improve the quality and completeness of the EM-DAT database.
By answering calls for projects together for research or technological development.
By doing an internship, a thesis, or a PhD with or in partnership with the CRED.
If you are considering a project that could directly benefit EM-DAT by improving global reporting of disaster-related impacts, we recommended that you contact the EM-DAT team to consider possible improvements of the database and thus add value to your results. For projects directly involving the CRED, however, we cannot accept all the opportunities for collaboration offered to us. We prioritize projects directly related to disaster epidemiology or that allow us to improve the coverage and quality of EM-DAT data substantially. If this applies to you, do not hesitate to contact us at the CRED.
7.4 - Contact
Address
The CRED is part of the Institute of Public Health (IRSS) of the University of Louvain (UCLouvain). You can reach us by mail at:
Contact Address
Centre for Research on the Epidemiology of Disasters (CRED)
Institute of Health & Society (IRSS)
Université catholique de Louvain (UCLouvain)
Clos Chapelle-aux-Champs, Bte B1.30.15, 1200 Brussels, Belgium
8.1 - Use Of EM-DAT Database Data and Derived Products
UCLouvain 2025
If you are an academic organization, a university, a non-profit research institution or an international public organization (UN agencies, multi-lateral banks, other multi-lateral institutions, and national governments) or part of a media agency (journalist, or press agency) with the intention to use the EM-DAT database (hereafter EM-DAT) for research, teaching or information purposes, you shall, conditional upon the acceptance of the present conditions of use, be granted free access to EM-DAT (see also Authorized Use).
Users of EM-DAT declare that they will not (see also Unauthorized Use)
Reproduce, copy, communicate, lend, or otherwise distribute EM-DAT or a substantial part of EM-DAT.
Reverse assemble, decompile, decompose, or disassemble EM-DAT.
Create substitute or derivative databases of EM-DAT.
Attempt to unlock or bypass any initialization or security systems used by EM-DAT.
Share, use or transmit any portion of EM-DAT via the Internet to unauthorized users.
Divulge the password to unauthorized users.
Remove, alter or obscure any proprietary legend, copyright, trademark, or other intellectual property right notice, logo, and image in or on EM-DAT.
Perform acts that conflict with the normal exploitation of EM-DAT or unreasonably prejudice the interest of the Licensor.
Make Commercial Use of EM-DAT, except in the event such users enter into a separate Database License Agreement, described hereafter.
If you are an entity (which may include a corporation, partnership, limited liability company, law firm, or other business organization) that is not an academic organization, university, non-profit research institution, or an international public organization (UN agencies, multi-lateral banks, other multi-lateral institutions, and national governments), the use of EM-DAT shall be considered to be Commercial Use. More precisely, this means the use of EM-DAT for a commercial purpose rather than for a public, non-profit, or educational purpose. A commercial purpose is considered when: the use of EM-DAT for, among others, sale, lease or license or the use of EM-DAT to perform contract research, to produce or to manufacture products for sale purposes, or to conduct research activities that result in any sale, lease, license, or transfer of EM-DAT to any organization. Except if agreed upon in a separate Database License Agreement, EM-DAT (including its data and derivate products) cannot be used for any commercial purpose.
In cases of Commercial Use, the user shall send a prior written request to Ms. Regina BELOW, EM-DAT data manager – regina.below@uclouvain.be (hereinafter “the Database Manager”) describing the aim of such Commercial Use and the number of users needing access to such data. Access shall be granted to EM-DAT upon proof of payment of the corresponding annual fee, as agreed in a separate Database License Agreement.
General Terms and Conditions
Access to EM-DAT shall be granted as of the moment the user agrees to it by clicking on the “I agree” button.
All published papers and technical reports from the EM-DAT Database owner related to EM-DAT may be used free of charge by the user, provided the user uses Proper Citation. Proper Citation of both EM-DAT and data obtained through EM-DAT is the responsibility of the user alone. “Proper Citation” of EM-DAT means:
Certain personal data may be collected and processed via our site in order to provide access to EM-DAT, for example, through the registration form. The collected personal data shall be used exclusively for the purpose indicated above, in accordance with the Belgian Law of December 8, 1992, on the protection of privacy in relation to the processing of personal data (as amended and the General Data Protection Regulation, Regulation (EU) 2016/679 of April 27, 2016, of the European Parliament and the Council Concerning the protection of individuals with regard to the processing of personal data and the free movement of such data and repealing Directive 95/46 / EC (General Data Protection Regulation)).
The CRED makes every effort to ensure, but cannot and does not guarantee, and makes no warranties as to, the accuracy, accessibility, integrity, and timeliness of this information. The CRED assumes no liability or responsibility for any errors or omissions in the content of this site and further disclaims any liability of any nature for any loss, howsoever caused, in connection with using EM-DAT. The CRED may make changes to EM-DAT at any time without notice. If you are undertaking an in-depth analysis, we recommend that you consult our staff to obtain a good understanding of the weaknesses, limitations, and peculiarities of our data;
Any use that causes unjustified damage to the legitimate interests of CRED – UCLouvain is strictly forbidden. The same applies to the use with the aim of creating a tool in competition with EM-DAT;
CRED reserves the right to restrict access by any user who contravenes these conditions of use.
8.2 - Database License Agreement (Commercial Use)
UCLouvain 2025
This Database License Agreement (the Agreement) is made between yourself (the Licensee) and Université catholique de Louvain (UCLouvain), a Belgian University with its registered office located at Place de l’Université, 1, B-1348 Louvain-la-Neuve, Belgium, acting through its Research Group “Center for Research on the Epidemiology of Disasters” or CRED (the Licensor).
WHEREAS the Licensor has developed the EM-DAT database (hereinafter the Database) made available on the internet subject to its conditions of use;
WHEREAS the Database aims at providing an objective basis for impact and vulnerability assessment and rational decision-making in disaster situations by collecting, organizing, and giving access to validated data on the human impact of disasters (such as the number of people killed, injured, or affected), and the disaster-related economic damage estimates;
The Licensor wishes to lay down the conditions enabling the Licensee to use the Database for Commercial Purposes.
Article 1: Ownership of the Database
The Licensor guarantees to be the owner of all intellectual property rights related to the Database, including all copyrights, and to determine the content of the Database. The Licensor shall, at all times, have the right amongst other decisions, without any prior notice or motivation, to (i) modify the data disclosed, (ii) disclose other data, (iii) suspend the availability of the Database for maintenance or any other purposes, (iv) decide to cease making available such Database. The Licensor shall notify the Licensee of any amendment that might have a consequence on the access rights of the Licensee by email at the Licensee’s email address.
Article 2: License Conditions of the Database
2.1. Subject to the terms set forth in this Agreement and conditional upon the payment of a license fee, the Licensor agrees to make available to the Licensee the data contained in the Database for Use as detailed in article 2.2 of this Agreement. For the sake of clarity, the Licensee shall be an entity (which may include a corporation, partnership, limited liability company, law firm, or other business organization) that is not an academic organization, a university, a non-profit research institution, or an international public organization (UN agencies, multi-lateral banks, other multi-lateral institution, or national governments).
2.2. Use means that the Licensor grants to the Licensee a limited, non-exclusive, non-transferable, and revocable license to use the Database for internal purposes by the Licensee’s direct employees. The Licensee shall not have the right to sell, assign, transfer, rent, lease, sublicense, lend, give, or make available to others or otherwise transfer or dispose of the Database in its present form or as converted or modified by Licensee or Licensor, or make the Database available in any manner for use by any subsidiary establishment of Licensee or by any other person, or firm, or customer.
Except if explicitly agreed upon by the Licensor, the Licensee shall not reverse, decompile, disassemble or otherwise reverse engineer the whole or part of the Database nor modify, adapt or translate the Database in any way nor merge the whole or part of the Database with any other Database.
2.3. The Licensee acknowledges that, except for the use rights granted in this article 2, no intellectual or any other proprietary right are granted, transferred, or assigned through this Agreement. All intellectual property rights, including but not limited to copyrights, trademark rights, and database rights, used or embodied in or in connection with the Database are and remain entirely with the Licensor.
2.4. Access to the Database. Upon completion of the registration information on www.emdat.be, acceptance of the present Database License Agreement, and payment of the license fee (article 4 of this Agreement), the Licensor shall provide the Licensee with a password for internet access to the Database. Data transmission and computer link to the Database through the internet shall be the sole and exclusive responsibility of the Licensee.
Article 3: Personal Data
The Licensee agrees that certain personal data may be collected and processed via our site, for example, through the registration form to be completed, in order to provide access to the Database. The collected personal data shall be used exclusively for the purpose indicated above. Licensor undertakes to process such data in accordance with the Belgian Law of July 30, 2018, on the protection of privacy in relation to the processing of personal data, as amended and the General Data Protection Regulation, Regulation (EU) 2016/679 of April 27, 2016, of the European Parliament and the Council Concerning the protection of individuals with regard to the processing of personal data and the free movement of such data and repealing Directive 95/46 / EC (General Data Protection Regulation) The legal texts can be consulted on the website of the Commission for the Protection of Privacy (statbel.fgov.be/en/about-statbel/privacy/privacy-gdpr).
The data collected is neither transferred nor transmitted to any other organization. However, the Licensor reserves the right to disclose information and personal data at the request of a legal authority in accordance with the laws and regulations in force.
Article 4: Fees
In exchange for the Commercial Use of the Database, the Licensee shall pay an annual fee equal to the amount of 6.000,00 EUR (TVA not included).
The Database shall be available upon proof of payment of the corresponding fee.
Article 5: Warranty and Liability
5.1. Warranty. The data contained in the Database are given for information purposes only and do not constitute any form of advice, recommendation, representation, or endorsement. The Licensor disclaims all warranties and/or conditions of any kind, expressed or implied, in respect of the functions, performances, completeness, or accuracy of the Database. Licensor does not guarantee that the functions or performances of the Database will meet the Licensee’s requirements, that the operation of the Database will be uninterrupted or error-free, or that any defects in the Database will be corrected. The Licensor shall have no obligation to repair or replace the Database under any circumstances.
The Licensor makes every effort to ensure, but cannot and does not guarantee, and makes no warranties as to, the accuracy, accessibility, integrity, and timeliness of this information. The Licensor assumes no liability or responsibility for any errors or omissions in the content of this site and further disclaims any liability of any nature for any loss, howsoever caused, in connection with using the Database. The Licensor may make changes to the Database at any time without notice. If you are undertaking in-depth analyses, we recommend that you consult our staff to obtain a good understanding of the weaknesses, limitations, and peculiarities of our data;
5.2. Liability. The Licensor shall in no event be liable for any business decision taken by the Licensee based on the data made available through the Database. The entire risk arising out of the use of the Database remains with the Licensee. Under no circumstances, including claims of negligence, shall the Licensor be liable for any damages whatsoever (including, without limitation, damages for loss of business profits, interruption of business activity, loss of business information, or other monetary loss) arising out of the use or inability to use the Database. More in particular, since the use of and access to the Database depends, in part, on third parties (e.g., telecommunications carriers) whose performance is outside Licensor’s control, the Licensor disclaims all liability for damages arising from the failure of the transmission or receipt of data.
The entire risk arising out of the possible reproduction and distribution of the Database remains with the Licensee.
Article 6: Citation
The Licensee agrees to use Proper Citation of the Database in all public use of the Database or its data. All published papers and technical reports from the Licensor related to the Database may be used free of charge by the Licensee, provided the Licensee uses Proper Citation. Proper Citation of both the Database and data obtained through the Database is the responsibility of the Licensee alone. “Proper Citation” of the Database means:
7.1. Term. This Agreement shall become effective as of the date upon which payment of the license fee has been received by the Licensor (the Effective Date) for a definite term of one (1) year counting as from such Effective Date.
7.2. Termination. The Agreement shall automatically terminate at its termination date.
The Agreement shall automatically terminate, without any compensation due, in case the Licensor no longer provides access to the Database or ceases its activities. The Licensor shall notify the Licensee of such termination with no undue delay at the Licensee’s email address.
Without prejudice to any other rights and remedies.
Under this Agreement or at law, the Licensor may have to claim compensation for damages incurred; the Licensor shall have the right to terminate the Agreement immediately without any prior notification in case of breach of use by the Licensee. In such case, the Licensee shall no longer have access to the Database and shall be notified hereof at the moment of the first login after termination.
7.3. Consequences of termination. Upon termination of this Agreement, the Licensee will cease and desist from all use of the Database and will uninstall, remove and destroy all copies of the Database in the Licensee’s possession or control, including any modified or merged portions thereof, in any form, and execute and deliver evidence of such actions to the Licensor. The Licensee shall remain bound by those provisions of the Agreement which, by their terms, extend beyond the date of termination.
Article 8: Miscellaneous
8.1. Assignment. Neither this Agreement nor any of the Licensee’s rights hereunder shall be assigned, sublicensed, or transferred (in insolvency proceedings, by mergers, acquisitions, or otherwise) by the Licensee without the previous written consent of the Licensor. Any assignment or other transfer which is inconsistent with the foregoing shall be null and void ab initio.
8.2. Entire Agreement. This Agreement constitutes the entire agreement between the parties with respect to the subject matter of this Agreement and supersedes all previous agreements, arrangements, or undertakings between Licensor and Licensee relating to its subject matter and any representations or warranties previously given or made to it, if any.
8.3. Failure or neglect of the Licensor to enforce any provision of this Agreement at any time shall not be construed or deemed to be a waiver of its rights and shall not in any way affect the validity of this Agreement or any of its provisions nor prejudice the Licensor’s right to take subsequent action.
8.4. In the event that any provision of this Agreement is deemed by any competent authority having jurisdiction to be invalid, unlawful, or unenforceable to any extent, that provision shall, to that extent, only be severed from the remaining provisions, which shall continue to be valid.
8.5. Jurisdiction venue. In the event of any dispute arising out of or in connection with the subject matter of this Agreement, the Parties shall first endeavor to resolve such dispute amicably within thirty (30) days after the date of the notification by one Party of such dispute to the other Party. Should the Parties fail to do so, then such dispute shall be subject to Belgian law except its conflicts of law rules and the competent courts of Brussels.