This is the multi-page printable view of this section. Click here to print.
Additional Resources and Tutorials
- 1: Tutorials
- 2: Additional Resources
- 3: FAQ
1 - Tutorials
1.1 - Python Tutorial 1: Basic Operations and Plotting
This tutorial shows basic examples on how to load, handle, and plot the EM-DAT data using the pandas Python data analysis package and the matplotlib charting library.
Note: The Jupyter Notebook version of this tutorial is available on the EM-DAT Python Tutorials GitHub Repository.
Import Modules
Let us import the necessary modules and print their versions. For this tutorial, we used pandas v.2.1.1 and matplotlib v.3.8.3. If your package versions are different, you may have to adapt this tutorial by checking the corresponding package documentation.
import pandas as pd #data analysis package
import matplotlib as mpl
import matplotlib.pyplot as plt #plotting library
for i in [pd, mpl]:
    print(i.__name__, i.__version__)
pandas 2.1.1
matplotlib 3.8.3
Load EM-DAT
To load EM-DAT:
- Download the EM-DAT data at https://public.emdat.be/ (registration is required, see the EM-DAT Documentation page on Data Accessibility);
- Use the pd.read_excel method to load and parse the data into a
pd.DataFrameobject; - Check if the data has been successfully parsed with the
pd.DataFrame.infomethod.
Notes:
- You may need to install the
openpyxlpackage or another engine to make it possible to read the data. - Another option is to export the
.xlsxfile into a.csv, and use thepd.read_csvmethod; - If not in the same folder as the Python code, replace the filename with the relative path or the full path, e.g.,
E:/MyDATa/public_emdat_2024-01-08.xlsx
#!pip install openpyxl
df = pd.read_excel('public_emdat_2024-01-08.xlsx') # <-- modify file name or path
df.info()
<class 'pandas.core.frame.DataFrame'>
RangeIndex: 15560 entries, 0 to 15559
Data columns (total 46 columns):
 #   Column                                     Non-Null Count  Dtype
---  ------                                     --------------  -----
 0   DisNo.                                     15560 non-null  object
 1   Historic                                   15560 non-null  object
 2   Classification Key                         15560 non-null  object
 3   Disaster Group                             15560 non-null  object
 4   Disaster Subgroup                          15560 non-null  object
 5   Disaster Type                              15560 non-null  object
 6   Disaster Subtype                           15560 non-null  object
 7   External IDs                               2371 non-null   object
 8   Event Name                                 4904 non-null   object
 9   ISO                                        15560 non-null  object
 10  Country                                    15560 non-null  object
 11  Subregion                                  15560 non-null  object
 12  Region                                     15560 non-null  object
 13  Location                                   14932 non-null  object
 14  Origin                                     3864 non-null   object
 15  Associated Types                           3192 non-null   object
 16  OFDA Response                              15560 non-null  object
 17  Appeal                                     15560 non-null  object
 18  Declaration                                15560 non-null  object
 19  AID Contribution ('000 US$)                490 non-null    float64
 20  Magnitude                                  3356 non-null   float64
 21  Magnitude Scale                            9723 non-null   object
 22  Latitude                                   1809 non-null   float64
 23  Longitude                                  1809 non-null   float64
 24  River Basin                                1197 non-null   object
 25  Start Year                                 15560 non-null  int64
 26  Start Month                                15491 non-null  float64
 27  Start Day                                  14068 non-null  float64
 28  End Year                                   15560 non-null  int64
 29  End Month                                  15401 non-null  float64
 30  End Day                                    14132 non-null  float64
 31  Total Deaths                               12485 non-null  float64
 32  No. Injured                                5694 non-null   float64
 33  No. Affected                               7046 non-null   float64
 34  No. Homeless                               1312 non-null   float64
 35  Total Affected                             11508 non-null  float64
 36  Reconstruction Costs ('000 US$)            33 non-null     float64
 37  Reconstruction Costs, Adjusted ('000 US$)  29 non-null     float64
 38  Insured Damage ('000 US$)                  691 non-null    float64
 39  Insured Damage, Adjusted ('000 US$)        683 non-null    float64
 40  Total Damage ('000 US$)                    3070 non-null   float64
 41  Total Damage, Adjusted ('000 US$)          3020 non-null   float64
 42  CPI                                        15056 non-null  float64
 43  Admin Units                                8336 non-null   object
 44  Entry Date                                 15560 non-null  object
 45  Last Update                                15560 non-null  object
dtypes: float64(20), int64(2), object(24)
memory usage: 5.5+ MB
Example 1: Japan Earthquake Data
Filtering
Let us focus on the EM-DAT earthquakes in Japan from the years 2000 to 2003 and create a suitable filter utilizing the EM-DAT columns Disaster Type, ISO and Start Year.
For simplicity, let’s retain only the columns Start Year, Magnitude, and Total Deaths and display the first five entries using the pd.DataFrame.head method.
Note: For further details about the columns, we refer to the EM-DAT Documentation page EM-DAT Public Table.
eq_jpn = df[
    (df['Disaster Type'] == 'Earthquake') &
    (df['ISO'] == 'JPN') &
    (df['Start Year'] < 2024)
][['Start Year', 'Magnitude', 'Total Deaths', 'Total Affected']]
eq_jpn.head(5)
| Start Year | Magnitude | Total Deaths | Total Affected | |
|---|---|---|---|---|
| 392 | 2000 | 6.1 | 1.0 | 100.0 |
| 610 | 2000 | 6.7 | NaN | 7132.0 |
| 1013 | 2001 | 6.8 | 2.0 | 11261.0 |
| 2791 | 2003 | 7.0 | NaN | 2303.0 |
| 2884 | 2003 | 5.5 | NaN | 18191.0 |
Grouping
Let us group the data to calculate the number of earthquake events by year and plot the results.
- Use the
groupbymethod to group based on one or more columns in a DataFrame, e.g.,Start Year; - Use the
sizemethod as an aggregation method (orcount). - Plot the results using the
pd.DataFrame.plotmethod.
Note: The count method provides the total number of non-missing values, while size gives the total number of elements (including missing values). Since the field Start Year is always defined, both methods should return the same results.
eq_jpn.groupby(['Start Year']).size().plot(kind='bar', ylabel='Count')
<Axes: xlabel='Start Year', ylabel='Count'>
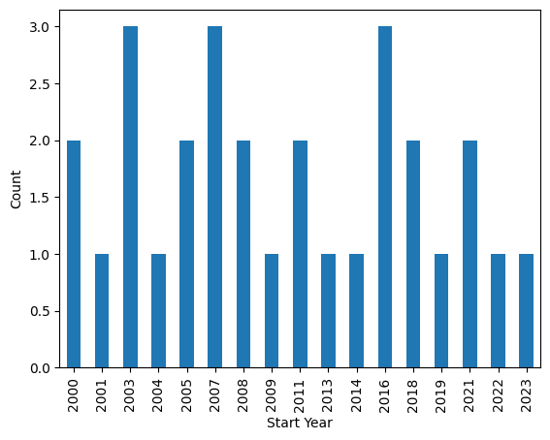
Output plot
Customize Chart
The pandas library relies on the matplotlib package to draw charts. To have more flexibility on the rendered chart, let us create the figure using the imported plt submodule.
# Group earthquake data by 'Start Year' and count occurrences
eq_cnt = eq_jpn.groupby(['Start Year']).size()

# Initialize plot with specified figure size
fig, ax = plt.subplots(figsize=(7, 2))

# Plot number of earthquakes per year
ax.bar(eq_cnt.index, eq_cnt)

# Set axis labels and title
ax.set_xlabel('Year')
ax.set_ylabel('N° of Earthquakes')
ax.set_yticks([0, 1, 2, 3])  # Define y-axis tick marks
ax.set_title('EM-DAT Earthquakes in Japan (2000-2023)')
Text(0.5, 1.0, 'EM-DAT Earthquake in Japan (2000-2023)')
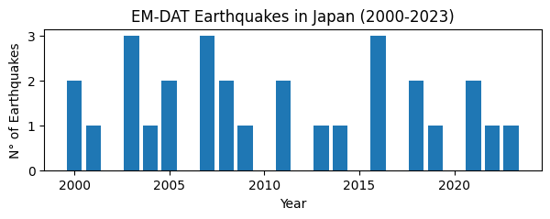
Output plot
Example 2: Comparing Regions
Let us compare earthquake death toll by continents. As before, we filter the original dataframe df according to our specific needs, including the Region column.
eq_all = df[
    (df['Disaster Type'] == 'Earthquake') &
    (df['Start Year'] < 2024)
][['Start Year', 'Magnitude', 'Region', 'Total Deaths', 'Total Affected']]
eq_all.head(5)
| Start Year | Magnitude | Region | Total Deaths | Total Affected | |
|---|---|---|---|---|---|
| 23 | 2000 | 4.3 | Asia | NaN | 1000.0 |
| 33 | 2000 | 5.9 | Asia | 7.0 | 1855007.0 |
| 36 | 2000 | 4.9 | Asia | 1.0 | 10302.0 |
| 41 | 2000 | 5.1 | Asia | NaN | 62030.0 |
| 50 | 2000 | 5.3 | Asia | 1.0 | 2015.0 |
In this case,
- Use the
groupbymethod to group based on theRegioncolumn; - Use the
summethod for theTotal Deathsfield as aggregation method; - Plot the results easilly using the
pd.DataFrame.plotmethod.
eq_sum = eq_all.groupby(['Region'])['Total Deaths'].sum()
eq_sum
Region
Africa        5863.0
Americas    229069.0
Asia        548766.0
Europe         783.0
Oceania        641.0
Name: Total Deaths, dtype: float64
Finally, let us make an horizontal bar chart of it using matplotlib. In particular,
- use the
ax.ticklabel_formatmethod to set the x axis label as scientific (in thousands of deaths); - use the
ax.invert_yaxisto display the regions in alphabetical order from top to bottom.
fig, ax = plt.subplots(figsize=(4,3))
ax.barh(eq_sum.index, eq_sum)
ax.set_xlabel('Total Earthquake Deaths')
ax.ticklabel_format(style='sci',scilimits=(3,3),axis='x')
ax.invert_yaxis()
ax.set_title('EM-DAT Earthquake Deaths by Regions')
Text(0.5, 1.0, 'EM-DAT Earthquake Deaths by Regions')
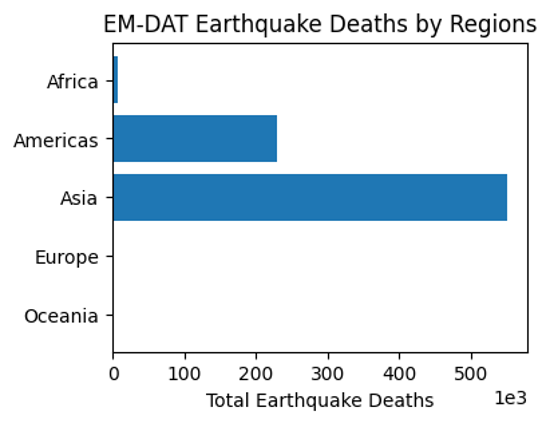
Output plot
Example 3: Multiple Grouping
At last, let us report the earthquake time series by continents. To avoid the creation of a ['Region', 'Start Year'] multiindex for future processing, we set the argument as_index to False. As such, Region and Start Year remain columns.
eq_reg_ts = eq_all.groupby(
    ['Region', 'Start Year'], as_index=False
)['Total Deaths'].sum()
eq_reg_ts
| Region | Start Year | Total Deaths | |
|---|---|---|---|
| 0 | Africa | 2000 | 1.0 |
| 1 | Africa | 2001 | 0.0 |
| 2 | Africa | 2002 | 47.0 |
| 3 | Africa | 2003 | 2275.0 |
| 4 | Africa | 2004 | 943.0 |
| ... | ... | ... | ... |
| 92 | Oceania | 2016 | 2.0 |
| 93 | Oceania | 2018 | 181.0 |
| 94 | Oceania | 2019 | 0.0 |
| 95 | Oceania | 2022 | 7.0 |
| 96 | Oceania | 2023 | 8.0 |
97 rows × 3 columns
Next, we apply the pivot method to restructure the table in a way it could be plot easilly.
eq_pivot_ts = eq_reg_ts.pivot(
    index='Start Year', columns='Region', values='Total Deaths'
)
eq_pivot_ts.head()
| Region | Africa | Americas | Asia | Europe | Oceania |
|---|---|---|---|---|---|
| Start Year | |||||
| 2000 | 1.0 | 9.0 | 205.0 | 0.0 | 2.0 |
| 2001 | 0.0 | 1317.0 | 20031.0 | 0.0 | 0.0 |
| 2002 | 47.0 | 0.0 | 1554.0 | 33.0 | 5.0 |
| 2003 | 2275.0 | 38.0 | 27301.0 | 3.0 | NaN |
| 2004 | 943.0 | 10.0 | 226336.0 | 1.0 | NaN |
ax = eq_pivot_ts.plot(kind='bar', width=1, figsize=(6,3))
ax.set_ylabel('Total Deaths')
ax.set_title('EM-DAT Earthquake Deaths by Regions')
Text(0.5, 1.0, 'EM-DAT Earthquake Deaths by Regions')
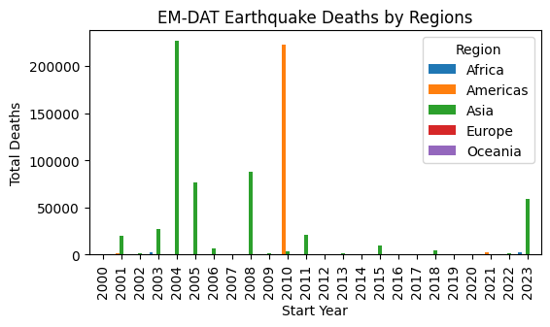
Output plot
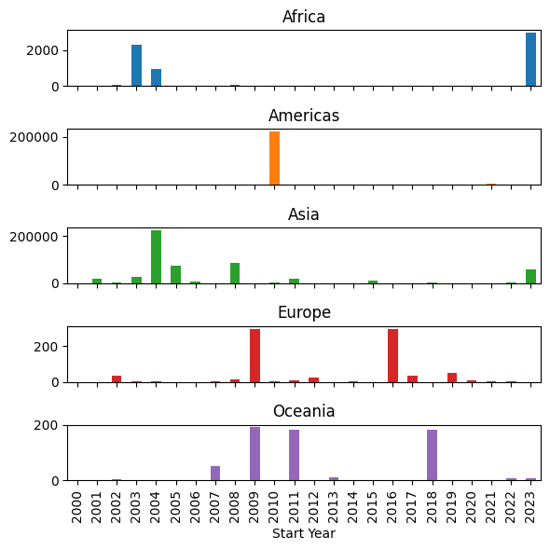
In order to be able to visualize the data in more details, let us make a subplot instead by setting the subplot argument to True within the plot method.
ax = eq_pivot_ts.plot(kind='bar', subplots=True, legend=False, figsize=(6,6))
plt.tight_layout() # <-- adjust plot layout
Output plot
We have just covered the most common manipulations applied to a pandas DataFrame containing the EM-DAT data. To delve further into your analyses, we encourage you to continue your learning of pandas and matplotlib with the many resources available online, starting with the official documentation.
If you are interested in learning the basics of making maps based on EM-DAT data, you can also follow the second EM-DAT Python Tutorial.
1.2 - Python Tutorial 2: Making Maps
If you have followed the first EM-DAT Python Tutorial 1 or are already familiar with pandas and matplotlib, this second tutorial will show you basic examples on how to make maps with the EM-DAT data using the geopandas Python package.
Note: The Jupyter Notebook version of this tutorial is available on the EM-DAT Python Tutorials GitHub Repository.
Import Modules
Let us import the necessary modules and print their versions. For this tutorial, we used pandas v.2.1.1, geopandas v.0.14.3, and matplotlib v.3.8.3. If your package versions are different, you may have to adapt this tutorial by checking the corresponding package documentation.
import pandas as pd #data analysis package
import geopandas as gpd
import matplotlib as mpl
import matplotlib.pyplot as plt #plotting library
for i in [pd, gpd, mpl]:
    print(i.__name__, i.__version__)
pandas 2.2.1
geopandas 0.14.3
matplotlib 3.8.3
Creating a World Map
To create a world map, we need the EM-DAT data and a shapefile containing the country geometries.
EM-DAT: We download and load the EM-DAT data using pandas.
Country Shapefile: We download a country shapefile from Natural Earth Data. For a world map, we download the low resolution 1:110m Adimin 0 - Countries (last accessed: March 10, 2024) and unzip it.
Load and Filter EM-DAT
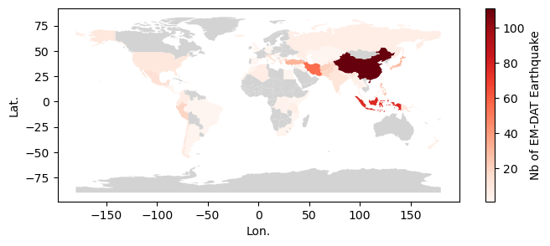
Let us load EM-DAT and filter it to make a global map of Earthquake disasters between 2000 and 2023. We calculate the number of unique identifiers (DisNo.) per country (ISO) We refer to the standard ISO column instead of the Country column of the EM-DAT Public Table to be able to make a join with the country shapefile.
df = pd.read_excel('public_emdat_2024-01-08.xlsx')
earthquake_counts = df[
    (df['Disaster Type'] == 'Earthquake') &
    (df['Start Year'] < 2024)
].groupby('ISO')["DisNo."].count().reset_index(name='EarthquakeCount')
earthquake_counts
| ISO | EarthquakeCount | |
|---|---|---|
| 0 | AFG | 21 |
| 1 | ALB | 4 |
| 2 | ARG | 2 |
| 3 | ASM | 1 |
| 4 | AZE | 3 |
| ... | ... | ... |
| 86 | USA | 10 |
| 87 | UZB | 1 |
| 88 | VUT | 2 |
| 89 | WSM | 1 |
| 90 | ZAF | 2 |
91 rows × 2 columns
Load the Country Shapefile
We use the gpd.read_file method to load the country shapefile and parse it into a geodataframe. A geodataframe is similar to a pandas dataframe, extept that has a geometry column.
We provide the filename argument, which is either a file name if located in the same directory than the running script, or a relative or absolute path, if not. In our case the shapefile with the .shp extension is located in the ne_110m_admin_0_countries folder.
Since the geodataframe contains 169 columns, we only keep the two column that we are interrested in, i.e., ISO_A3 and geometry.
gdf = gpd.read_file ('ne_110m_admin_0_countries/ne_110m_admin_0_countries.shp') # <-- Change path if necessary
gdf = gdf[['ISO_A3', 'geometry']]
gdf
Cannot find header.dxf (GDAL_DATA is not defined)
| ISO_A3 | geometry | |
|---|---|---|
| 0 | FJI | MULTIPOLYGON (((180.00000 -16.06713, 180.00000... |
| 1 | TZA | POLYGON ((33.90371 -0.95000, 34.07262 -1.05982... |
| 2 | ESH | POLYGON ((-8.66559 27.65643, -8.66512 27.58948... |
| 3 | CAN | MULTIPOLYGON (((-122.84000 49.00000, -122.9742... |
| 4 | USA | MULTIPOLYGON (((-122.84000 49.00000, -120.0000... |
| ... | ... | ... |
| 172 | SRB | POLYGON ((18.82982 45.90887, 18.82984 45.90888... |
| 173 | MNE | POLYGON ((20.07070 42.58863, 19.80161 42.50009... |
| 174 | -99 | POLYGON ((20.59025 41.85541, 20.52295 42.21787... |
| 175 | TTO | POLYGON ((-61.68000 10.76000, -61.10500 10.890... |
| 176 | SSD | POLYGON ((30.83385 3.50917, 29.95350 4.17370, ... |
177 rows × 2 columns
Important Notice: Above, some geometries do not have a ISO code, such as the one at row 174. Below, you will see that some ISO in EM-DAT are not matched with a geometries. Beyond this basic tutorial, we advice to carefully evaluate these correspondance and non-correspondance between ISO codes and to read the EM-DAT Documentation about ISO codes.
Join the Two Datasets
Let us merge the two dataset with an outer join, using the merge method. We prefer an outer join to keep the geometries of countries for which EM-DAT has no records.
earthquake_counts_with_geom = gdf.merge(
    earthquake_counts, left_on='ISO_A3', right_on='ISO', how='outer')
earthquake_counts_with_geom
| ISO_A3 | geometry | ISO | EarthquakeCount | |
|---|---|---|---|---|
| 0 | -99 | MULTIPOLYGON (((15.14282 79.67431, 15.52255 80... | NaN | NaN |
| 1 | -99 | MULTIPOLYGON (((-51.65780 4.15623, -52.24934 3... | NaN | NaN |
| 2 | -99 | POLYGON ((32.73178 35.14003, 32.80247 35.14550... | NaN | NaN |
| 3 | -99 | POLYGON ((48.94820 11.41062, 48.94820 11.41062... | NaN | NaN |
| 4 | -99 | POLYGON ((20.59025 41.85541, 20.52295 42.21787... | NaN | NaN |
| ... | ... | ... | ... | ... |
| 185 | NaN | None | WSM | 1.0 |
| 186 | YEM | POLYGON ((52.00001 19.00000, 52.78218 17.34974... | NaN | NaN |
| 187 | ZAF | POLYGON ((16.34498 -28.57671, 16.82402 -28.082... | ZAF | 2.0 |
| 188 | ZMB | POLYGON ((30.74001 -8.34001, 31.15775 -8.59458... | NaN | NaN |
| 189 | ZWE | POLYGON ((31.19141 -22.25151, 30.65987 -22.151... | NaN | NaN |
190 rows × 4 columns
Make the Map
To make the map, we use the geopandas built-in API, through the plot method built on the top of matplotlib.
Below, we show an hybrid plotting approach and first create an empty figure fig and ax object with matplotlib before passing the ax object as an argument within the plot method. This approach gives more control to users familiar with matplotlib to further customize the chart.
fig, ax = plt.subplots(figsize=(8,3))
earthquake_counts_with_geom.plot(
    column='EarthquakeCount',
    ax=ax,
    cmap='Reds',
    vmin=1,
    legend=True,
    legend_kwds={"label": "Nb of EM-DAT Earthquake"},
    missing_kwds= dict(color = "lightgrey",)
)
_ = ax.set_xlabel('Lon.')
_ = ax.set_ylabel('Lat.')
Output plot
Creating a Map at Admin Level 1
We can create a more detailed map using the Admin Units column in the EM-DAT Public Table. This column contains the identifiers of administrative units of level 1or 2 as defined by the Global Administrative Unit Layer (GAUL) for country impacted by non-biological natural hazards.
Similarly to the country map, we need to download a file containing GAUL geometries. The file corresponds to the last version of GAUL published in 2015. In this tutorial, we will focus on Japanese earthquake occurrence in EM-DAT.
Note: the file size is above 1.3Go and requires a performant computer to process in Python. Using a Geographical Information Software (GIS) for the preprocessing is another option.
Load the Admin Units Geopackage
The file is a geopackage .gpkg that contains multiple layers. Let us first describe these layers with the fiona package, which is a geopandas dependency.
import fiona
print(fiona.__name__, fiona.__version__)
for layername in fiona.listlayers('gaul2014_2015.gpkg'):
    with fiona.open('gaul2014_2015.gpkg', layer=layername) as src:
        print(layername, len(src))
fiona 1.9.5
level2 38258
level1 3422
level0 277
- The
level0layer contains the country geometries defined in GAUL. - Here, we make a map at the
level1. - Still, we need to load the administrative
level2because theAdmin Unitscolumn may refer to Admin 2 levels without mentionning the corresponding Admin 1 level. - Given the high size the admin 2 layer, we filter the data about Japan and overwrite our geodataframe variable to save memory.
gaul_adm2 = gpd.read_file ('gaul2014_2015.gpkg', layer='level2')
gaul_adm2 = gaul_adm2[gaul_adm2['ADM0_NAME'] == 'Japan']
gaul_adm2.info()
<class 'geopandas.geodataframe.GeoDataFrame'>
Index: 3348 entries, 23205 to 26552
Data columns (total 13 columns):
 #   Column      Non-Null Count  Dtype
---  ------      --------------  -----
 0   ADM2_CODE   3348 non-null   int64
 1   ADM2_NAME   3348 non-null   object
 2   STR2_YEAR   3348 non-null   int64
 3   EXP2_YEAR   3348 non-null   int64
 4   ADM1_CODE   3348 non-null   int64
 5   ADM1_NAME   3348 non-null   object
 6   STATUS      3348 non-null   object
 7   DISP_AREA   3348 non-null   object
 8   ADM0_CODE   3348 non-null   int64
 9   ADM0_NAME   3348 non-null   object
 10  Shape_Leng  3348 non-null   float64
 11  Shape_Area  3348 non-null   float64
 12  geometry    3348 non-null   geometry
dtypes: float64(2), geometry(1), int64(5), object(5)
memory usage: 366.2+ KB
The Admin 2 geodataframe has 12 columns describing the 3348 level 2 administrative units in Japan.
Filter EM-DAT Data
df_jpn = df[
    (df['ISO'] == 'JPN') &
    (df['Disaster Type'] == 'Earthquake') &
    (df['Start Year'] < 2024)
][['DisNo.', 'Admin Units']]
df_jpn
| DisNo. | Admin Units | |
|---|---|---|
| 392 | 2000-0428-JPN | [{"adm2_code":36308,"adm2_name":"Koodusimamura... |
| 610 | 2000-0656-JPN | [{"adm1_code":1680,"adm1_name":"Okayama"},{"ad... |
| 1013 | 2001-0123-JPN | [{"adm1_code":1654,"adm1_name":"Ehime"},{"adm1... |
| 2791 | 2003-0249-JPN | [{"adm1_code":1652,"adm1_name":"Akita"},{"adm1... |
| 2884 | 2003-0354-JPN | [{"adm2_code":35135,"adm2_name":"Hurukawasi"},... |
| 3014 | 2003-0476-JPN | [{"adm1_code":1661,"adm1_name":"Hokkaidoo"}] |
| 3824 | 2004-0532-JPN | [{"adm1_code":1690,"adm1_name":"Tookyoo"},{"ad... |
| 4182 | 2005-0129-JPN | [{"adm1_code":1656,"adm1_name":"Hukuoka"}] |
| 4253 | 2005-0211-JPN | [{"adm1_code":1656,"adm1_name":"Hukuoka"},{"ad... |
| 5769 | 2007-0101-JPN | [{"adm1_code":1678,"adm1_name":"Niigata"},{"ad... |
| 5912 | 2007-0258-JPN | [{"adm1_code":1675,"adm1_name":"Nagano"},{"adm... |
| 6311 | 2007-0654-JPN | [{"adm1_code":1672,"adm1_name":"Mie"},{"adm1_c... |
| 6606 | 2008-0242-JPN | [{"adm1_code":1652,"adm1_name":"Akita"},{"adm2... |
| 6637 | 2008-0275-JPN | [{"adm2_code":33543,"adm2_name":"Hatinohesi"}] |
| 7335 | 2009-0320-JPN | [{"adm1_code":1690,"adm1_name":"Tookyoo"},{"ad... |
| 8403 | 2011-0082-JPN | [{"adm1_code":1652,"adm1_name":"Akita"},{"adm1... |
| 8447 | 2011-0130-JPN | [{"adm1_code":1695,"adm1_name":"Yamagata"},{"a... |
| 9596 | 2013-0127-JPN | [{"adm1_code":1662,"adm1_name":"Hyoogo"}] |
| 10468 | 2014-0465-JPN | [{"adm2_code":35261,"adm2_name":"Hakubamura"}] |
| 11276 | 2016-0107-JPN | [{"adm1_code":1670,"adm1_name":"Kumamoto"}] |
| 11291 | 2016-0121-JPN | [{"adm1_code":1670,"adm1_name":"Kumamoto"},{"a... |
| 11631 | 2016-0492-JPN | [{"adm2_code":36364,"adm2_name":"Kurayosisi"}] |
| 12449 | 2018-0183-JPN | [{"adm1_code":1662,"adm1_name":"Hyoogo"},{"adm... |
| 12589 | 2018-0330-JPN | [{"adm2_code":34179,"adm2_name":"Atumatyoo"},{... |
| 13030 | 2019-0322-JPN | [{"adm1_code":1664,"adm1_name":"Isikawa"},{"ad... |
| 13949 | 2021-0105-JPN | [{"adm2_code":33868,"adm2_name":"Namiemati"}] |
| 14005 | 2021-0194-JPN | [{"adm1_code":1651,"adm1_name":"Aiti"},{"adm1_... |
| 14584 | 2022-0153-JPN | NaN |
| 15236 | 2023-0279-JPN | NaN |
Note: The last two events were not geolocated at a higher administrative levels.
Convert Admin 2 units to Admin 1 units
We create a python function, json_to_amdmin1, to extract the administrative level 1 codes from the Admin Units column of EM-DAT, based on the ADM1_CODE and ADM2_CODE of the Japan geodataframe.
import json

def json_to_admin1(json_str, gdf):
    """
    Convert a JSON string to a set of administrative level 1 codes.

    Parameters
    ----------
    json_str
        A JSON string representing administrative areas, or None.
    gdf
        A GeoDataFrame containing administrative codes and their corresponding
        levels.

    Returns
    -------
    A set of administrative level 1 (ADM1) codes extracted from the input JSON.

    Raises
    ------
    ValueError
        If the administrative code is missing from the input data or ADM2_CODE
        not found in the provided GeoDataFrame.

    """
    adm_list = json.loads(json_str) if isinstance(json_str, str) else None
    adm1_list = []
    if adm_list is not None:
        for entry in adm_list:
            if 'adm1_code' in entry.keys():
                adm1_code = entry['adm1_code']
            elif 'adm2_code' in entry.keys():
                gdf_sel = gdf[gdf['ADM2_CODE'] == entry['adm2_code']]
                if not gdf_sel.empty:
                    adm1_code = gdf_sel.iloc[0]['ADM1_CODE']
                else:
                    raise ValueError(
                        'ADM2_CODE not found in the provided GeoDataFrame.'
                    )
            else:
                raise ValueError(
                    'Administrative code is missing from the provided data.'
                )
            adm1_list.append(adm1_code)
    return set(adm1_list)
We apply the function to all elements of the Admin Units column.
df_jpn.loc[:, 'Admin_1'] = df_jpn['Admin Units'].apply(
    lambda x: json_to_admin1(x, gaul_adm2))

df_jpn[['Admin Units', 'Admin_1']]
| Admin Units | Admin_1 | |
|---|---|---|
| 392 | [{"adm2_code":36308,"adm2_name":"Koodusimamura... | {1690} |
| 610 | [{"adm1_code":1680,"adm1_name":"Okayama"},{"ad... | {1680, 1691, 1686} |
| 1013 | [{"adm1_code":1654,"adm1_name":"Ehime"},{"adm1... | {1660, 1654} |
| 2791 | [{"adm1_code":1652,"adm1_name":"Akita"},{"adm1... | {1665, 1673, 1652, 1653, 1695} |
| 2884 | [{"adm2_code":35135,"adm2_name":"Hurukawasi"},... | {1673} |
| 3014 | [{"adm1_code":1661,"adm1_name":"Hokkaidoo"}] | {1661} |
| 3824 | [{"adm1_code":1690,"adm1_name":"Tookyoo"},{"ad... | {1690, 1678} |
| 4182 | [{"adm1_code":1656,"adm1_name":"Hukuoka"}] | {1656} |
| 4253 | [{"adm1_code":1656,"adm1_name":"Hukuoka"},{"ad... | {1656, 1683} |
| 5769 | [{"adm1_code":1678,"adm1_name":"Niigata"},{"ad... | {1664, 1692, 1678} |
| 5912 | [{"adm1_code":1675,"adm1_name":"Nagano"},{"adm... | {1675, 1692, 1678} |
| 6311 | [{"adm1_code":1672,"adm1_name":"Mie"},{"adm1_c... | {1672, 1677, 1685} |
| 6606 | [{"adm1_code":1652,"adm1_name":"Akita"},{"adm2... | {1665, 1673, 1652} |
| 6637 | [{"adm2_code":33543,"adm2_name":"Hatinohesi"}] | {1653} |
| 7335 | [{"adm1_code":1690,"adm1_name":"Tookyoo"},{"ad... | {1690, 1687} |
| 8403 | [{"adm1_code":1652,"adm1_name":"Akita"},{"adm1... | {1665, 1668, 1693, 1673, 1675, 1695, 1652, 165... |
| 8447 | [{"adm1_code":1695,"adm1_name":"Yamagata"},{"a... | {1673, 1695} |
| 9596 | [{"adm1_code":1662,"adm1_name":"Hyoogo"}] | {1662} |
| 10468 | [{"adm2_code":35261,"adm2_name":"Hakubamura"}] | {1675} |
| 11276 | [{"adm1_code":1670,"adm1_name":"Kumamoto"}] | {1670} |
| 11291 | [{"adm1_code":1670,"adm1_name":"Kumamoto"},{"a... | {1674, 1683, 1670} |
| 11631 | [{"adm2_code":36364,"adm2_name":"Kurayosisi"}] | {1691} |
| 12449 | [{"adm1_code":1662,"adm1_name":"Hyoogo"},{"adm... | {1682, 1677, 1662, 1671} |
| 12589 | [{"adm2_code":34179,"adm2_name":"Atumatyoo"},{... | {1661} |
| 13030 | [{"adm1_code":1664,"adm1_name":"Isikawa"},{"ad... | {1664, 1673, 1678, 1695} |
| 13949 | [{"adm2_code":33868,"adm2_name":"Namiemati"}] | {1657} |
| 14005 | [{"adm1_code":1651,"adm1_name":"Aiti"},{"adm1_... | {1664, 1665, 1668, 1671, 1672, 1673, 1675, 167... |
| 14584 | NaN | {} |
| 15236 | NaN | {} |
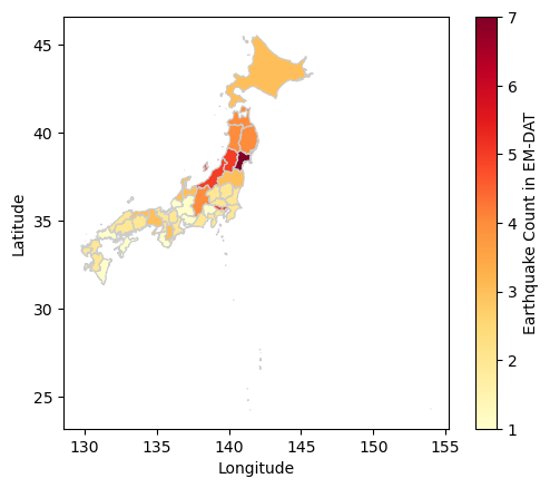
Count Earthquakes per Admin 1 Units
The can be done applying the explode method on the new Admin_1 column. The method will add rows based on the number of Admin 1 we have in each set inside the Admin_1 column. Then the counting can be performed using the former groupby approach.
count_per_adm1 = df_jpn.explode('Admin_1').groupby(
    'Admin_1')['DisNo.'].count().rename('EQ Count')
count_per_adm1.head()
Admin_1
1651    1
1652    4
1653    4
1654    1
1655    1
Name: EQ Count, dtype: int64
Recreate the Admin 1 Layer
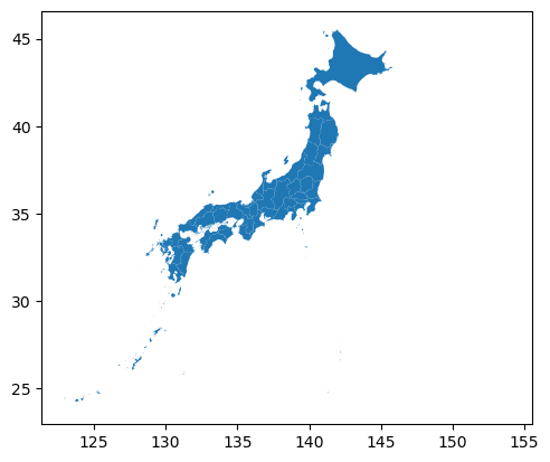
Since the Japan geodataframe contains the admin2 geometries, we could load the Admin 1 layer or simply dissolve the geometries based on the ADM1_CODE column. The geopandas package is equipped with the dissolve method.
gdf_jpn_adm1 = gaul_adm2.dissolve(by='ADM1_CODE')
gdf_jpn_adm1.plot()
<Axes: >
Output plot
Join the Two Datasets
Again, we can use the merge method to join the datasets together, here, based on their index.
gdf_jpn_adm1_merged = gdf_jpn_adm1.merge(count_per_adm1,
                                         left_index=True,
                                         right_index=True,
                                         how='outer')
Make the Map
fig, ax = plt.subplots()

gdf_jpn_adm1_merged.plot(
    column='EQ Count', cmap='YlOrRd',
    linewidth=0.8, ax=ax,edgecolor='0.8',
    legend=True,
    legend_kwds={'label': "Earthquake Count in EM-DAT"}
)
_ = ax.set_xlabel('Longitude')
_ = ax.set_ylabel('Latitude')
Output plot
We have just covered the basics on how to join the EM-DAT pandas DataFrame with a geopandas GeoDataFrame to make maps. To delve further into your analyses, we encourage you to continue your learning of geopandas, matplotlib, or, in particular, cartopy for more advanced map customization, with the many resources available online.
2 - Additional Resources
Unless stated otherwise, these resources were neither developed nor are they maintained by the EM-DAT team. Please contact the corresponding authors with any questions.
EM-DAT Archive
The EM-DAT Archive, hosted on the University of Louvain (UCLouvain) Dataverse and maintained by the EM-DAT team, preserves official versions of the EM-DAT public data to support open and reproducible research. Each version includes the EM-DAT Public Table, its column description, and a PDF copy of this documentation, and is released under a CC BY-NC-ND 4.0 license (see also Data Accessibility).
| Version | Release Date | Data Download Date | Records Period | EM-TEST Version | Reference |
|---|---|---|---|---|---|
| 2.0 | 2026-04-30 | 2026-04-30 | 1900–2024 | v2026.05.0 | Delforge et al. (2026) |
| 1.1 | 2025-07-09 | 2024-12-04 | 1900–2023 | v2024.12.0 | Delforge et al. (2025) |
| 1.0 | 2024-12-18 | 2024-12-04 | 1900–2023 | v2024.12.0 | Delforge et al. (2025) |
Version 1.1 contains the same data files as version 1.0. When using an archived version, please cite the corresponding reference:
- Version 2.0: Delforge, D., Below, R., Wathelet, V., Alonso, A., & Speybroeck, N. (2026). The 2024 Emergency Events Database Archive: The year in review and historical data updates [Preprint]. Zenodo. https://doi.org/10.5281/zenodo.20071134
- Versions 1.0 and 1.1: Delforge, D., Wathelet, V., Below, R., Lanfredi Sofia, C., Tonnelier, M., van Loenhout, J. A. F., & Speybroeck, N. (2025). EM-DAT: The Emergency Events Database. International Journal of Disaster Risk Reduction, 124, Article 105509. https://doi.org/10.1016/j.ijdrr.2025.105509
Software
- EM-VIEW: A Streamlit Dashboard to explore and analyze the EM-DAT Public Table. Also available as a GitHub repo for customization. Learn more from its initial announcement.
- EM-TEST: An open-source testing framework, built on the
pandasandpanderaPython packages, to validate EM-DAT public data files and check the compatibility between versions. Developed by the EM-DAT team and archived on Zenodo.
Augmented EM-DAT Data
- Geocoded Disasters (GDIS): an augmented dataset with geocoding, based on the GADM data, for 9,924 disasters between 1960 and 2018 (Rosvold & Buhaug, 2021).
- Flood Disasters (FLODIS): an augmented dataset for flood disasters (2000–2018), based on Tellman et al. (2021) and IDMC data, that links EM-DAT to hazard footprints, exposed and displaced population data (Mester et al., 2023).
- Geo-Disasters: geocoding of climate-related events in EM-DAT (Teber et al., 2026).
- Disaster Storylines and Knowledge Graphs: storylines and knowledge graphs for over 3,000 EM-DAT disasters (2014–2024), extracted from global news of the Europe Media Monitor using large language models and retrieval-augmented generation (Ronco et al., 2026).
Other Disaster Occurrence and Loss Datasets
- Wikimpacts 1.0: a global climate impact database built by extracting information from Wikipedia with large language models, covering 2,726 events from 1034 to 2024 at the event, national, and sub-national levels (Li et al., 2026).
- ROUGE: the Red Cross Operations Unified Global Emergency database, documenting socio-economic impacts of natural hazards at national and sub-national levels, extracted with large language models from operational reports of the International Federation of Red Cross and Red Crescent Societies (IFRC), with broad coverage of the Global South (Hasbini et al., 2026).
- HANZE v2.1: the Historical Analysis of Natural HaZards in Europe database, covering 2,521 riverine, pluvial, coastal, and compound flood events in 42 European countries from 1870 to 2020, with fatalities, affected persons, inundated areas, and economic losses (Paprotny et al., 2024).
- Risk Data Hub – Disaster Losses: a curated European dataset of historical disaster losses since 1980, harmonized from multiple sources by the Joint Research Centre (JRC) of the European Commission, with unique event identifiers at the national and European levels. The data can be explored through the Risk Data Hub dashboards and accessed through the Risk Data Hub API under a CC BY 4.0 license.
Other Useful Resources
- Worldwide disaster loss and damage databases: a systematic review comparing available disaster loss databases (Mazhin et al., 2021).
- Natural Disasters: a comprehensive global overview of natural hazards and disasters on Our World in Data (Ritchie et al., 2022).
- A note on missing values and imputations summarizing insights from Jones et al. (2022) and Jones et al. (2023).
3 - FAQ
Select a question to show its answer.
General
What is EM-DAT?
EM-DAT, the Emergency Events Database, is a global database of disasters triggered by natural hazards and technological disasters from 1900 to the present. It has been maintained by the Centre for Research on the Epidemiology of Disasters (CRED) at the University of Louvain (UCLouvain) since 1988. EM-DAT records the occurrence and the human and economic impacts of disasters at the country level, with over 27,000 disaster records. See the Overview of EM-DAT and Data Structure and Content.
Finding and Interpreting Records
I can’t find a recent disaster in EM-DAT
Two things can explain this.
- Scope. EM-DAT only publishes records of disasters that are confirmed by at least two sources and meet at least one of its Entry Criteria: 10 or more deaths, 100 or more people affected, a call for international assistance, or an emergency declaration.
- Publication delay. New events and impact figures are encoded daily. Once the impact figures stabilize, they are selected for publication and become available in the public data after the weekly update routine, usually run on Mondays (see Encoding, Quality Control, and Validation Procedure).
If you have reliable sources for an event you believe is missing, please share that information with us.
Why do some disasters have no impact figures (empty cells)?
An empty cell means either that the figure is unreported in EM-DAT sources or that the disaster had no impact of that kind. EM-DAT does not distinguish between the two, so an empty cell must never be read as a confirmed absence of impact.
These missing values are not randomly distributed and depend on hazard and impact types. Economic losses are reported far less often than human impacts, and insured damage is concentrated in countries with insurance coverage. See Accounting Biases and this note on missing values and imputation.
How are economic losses expressed?
All monetary values are in thousands of US dollars (‘000 US$). The unadjusted columns give the value at the time of the disaster, and the “Adjusted” columns correct them for inflation using the US Consumer Price Index (see Economic Adjustment). Economic losses are much less often reported than human impacts, especially outside high-impact disasters and insured markets (see Economic Impact Variables and Accounting Biases).
The impact figures have changed significantly since my last download
This is expected. EM-DAT is a living database, and the last two years of data are updated frequently, following the Encoding, Quality Control, and Validation Procedure.
- Figures for a recent event are provisional. As more mature sources become available, the database manager may update them.
- All entries from the previous year are systematically reviewed during the annual validation, which usually takes place at the beginning of the following year.
- Thematic reviews may revise a whole disaster type, period, or region at once. Substantial content updates are announced in the release notes.
The Entry Date and Last Update columns let you track when a record was created and last modified. For work that must remain reproducible, cite your access date and consider using the EM-DAT Archive, which provides fixed, citable snapshots.
Does EM-DAT include wars, conflicts, or terrorism?
No. EM-DAT covers disasters triggered by natural hazards and technological disasters, the latter being unintentional accidents. Situations of conflict, violence, and terrorism are out of scope (see General Definitions and Concepts). The former ‘Complex’ disaster group, which covered major famines not primarily driven by drought, was removed in September 2023 (14 entries); those records remain available in the legacy backup table.
Can I use EM-DAT to study trends in disaster occurrence?
With caution. The number of recorded disasters is influenced by EM-DAT’s external sources, their level of reporting precision, and whether they aggregate impacts from multiple hazards. The sharp rise in recorded disasters from the 1960s onward largely reflects improvements in reporting, communication technology, and the growth of the database itself, rather than a change in the underlying frequency of hazards (see Time Bias). Excluding pre-2000 data from trend analyses is recommended; these records are flagged in the Historic column. Even after 2000, threshold, geographic, hazard-related, and accounting biases remain. See Known Issues and Limitations.
Why do EM-DAT figures differ from another database or source?
There is no universal protocol governing how disaster losses are reported. Sources differ in how they define the start and end of an event, its geographical footprint, what counts as an “affected” person, and sometimes even the disaster type. EM-DAT reports the figures selected from its sources and does not model or harmonize them, apart from the Economic Adjustment for inflation. These systemic differences are discussed in General Issues.
Can I access information at the subnational level?
Partly. EM-DAT collects and reports impact figures at the country level only; they are not disaggregated between regions. However, the affected areas are listed in the GADM Admin Units column, which gives the Admin-1 or Admin-2 units affected by the disaster using the GADM 4.1 spatial reference. This geocoding is limited to non-biological natural hazards from 2000 onwards (see Spatial Information and Geocoding). The Location, Latitude, Longitude, and River Basin columns provide additional spatial context.
In other words, you can know which regions were affected, but not how the losses were distributed among them. If you need subnational impact estimates, several augmented datasets built on EM-DAT are listed under Additional Resources.
Access and Conditions of Use
Is EM-DAT free to use?
Yes, for non-commercial uses. Access to the EM-DAT Public Data is free of charge after registration for academic organizations, universities, non-profit research institutions, international public organizations, national governments, and media agencies, for research, teaching, or information purposes. Use is conditional on accepting the Terms of Use. Commercial use requires a paid Database License Agreement.
Free is not the same as open. Under standard international definitions, such as the Open Definition, which requires that data can be freely used, modified, and shared by anyone for any purpose, neither the Public Data nor the Archive qualifies as open data:
- The Public Data requires registration, is restricted to non-commercial use, and does not permit redistribution or the creation of derivative databases.
- The EM-DAT Archive is published under a CC BY-NC-ND 4.0 license, which excludes both commercial use and derivative works.
What EM-DAT aims to be is free and FAIR: findable, accessible, interoperable, and reusable, at no cost, for the research, humanitarian, and public-interest community. The EM-DAT Archive was created specifically to serve those principles.
Can I redistribute EM-DAT data?
It depends on the product.
EM-DAT Public Data: no. Under the Terms of Use, users agree not to reproduce, copy, communicate, lend, or otherwise distribute EM-DAT or a substantial part of it, not to create substitute or derivative databases, and not to share any portion of it with unauthorized users.
EM-DAT Archive: within the limits of its license. The Archive is published under CC BY-NC-ND 4.0, which allows you to share the dataset as it is, with proper attribution, for non-commercial purposes. It does not allow you to distribute a modified version. In practice, linking to the Archive DOI is preferable to circulating a copy: it is citable, versioned, and guarantees that your readers get exactly the snapshot you used.
In both cases, you may of course publish analyses, aggregated figures, charts, and findings derived from EM-DAT, provided you follow the Attribution and Citation Policy.
If you need to share the data behind a paper, share the DisNo. identifiers. Publish your own variables and results alongside the DisNo. values you worked with. Anyone with EM-DAT access can then join your table back to the corresponding EM-DAT records. This satisfies journal and funder reproducibility requirements without redistributing the database itself, and it keeps your results explicitly linked to documented EM-DAT entries.
Which EM-DAT product should I use for research?
- The EM-DAT Archive is a validated, versioned, citable snapshot hosted on the UCLouvain Dataverse and adhering to FAIR principles. It is the preferred choice for reproducible research.
- The EM-DAT Public Data is the living database, updated weekly. It can also be used for research and teaching. It is the right choice when you need the most recent records, but bear in mind that the last two years of data are revised frequently, so any analysis covering them should be dated and treated as provisional.
- The HDX Country Profiles provide annual aggregated figures by country and disaster type.
See also Data Accessibility.
Can I access EM-DAT programmatically?
The EM-DAT API is only available to commercial users. The EM-DAT Archive can be accessed programmatically through the UCLouvain Dataverse, using the standard Dataverse API. This is the recommended route for scripted or reproducible workflows. However, fetching the Archive regularly is not useful, as new versions are released only about once a year. The HDX Country Profiles can also be accessed through the HDX API.
How should I cite EM-DAT?
Proper citation requires at least the year of access, the EM-DAT acronym with the product used, and the corresponding URL or DOI. Full rules and examples are available in the Attribution and Citation Policy. For scientific publications, please also cite the database descriptor paper.
Tools and Visualization
How can I visualize the data?
- Start with the spreadsheet. The public table is delivered as a single flat
.xlsxfile, so if you are comfortable with Excel, pivot tables and charts will get you a long way without any additional tooling. - EM-VIEW is a dashboard for exploring and analyzing the EM-DAT data. Its source code is available if you want to customize it.
- The Python tutorials in this documentation cover basic operations, plotting, and mapping.
- The HDX Country Profiles are ready-to-use annual aggregates for quick country-level charts.
Further tools and augmented datasets are listed under Additional Resources. Note that most of these are not maintained by the EM-DAT team.
Contributing and Support
I would like to report errors or missing entries
Please write to contact@cred.be.
For issues concerning specific events, describe the problem and include the list of DisNo. values concerned. For missing entries, keep in mind that CRED only publishes disasters for which reliable figures are available and corroborated by at least two sources; sending the sources you have is the most useful thing you can do.
If you have analyzed EM-DAT quality more broadly, we welcome your reports and publications. Reported issues also feed the automated checks that prevent errors from recurring. CRED reserves the right to modify the data following such notifications. See also Issue Reporting.
I would like to support EM-DAT
Since the end of the USAID funding in early 2025, sustaining the world’s collective disaster memory depends more than ever on the EM-DAT community. You can help by donating, signing the open letter, citing EM-DAT properly, reporting errors, sharing your work, or collaborating with us on research projects. All the options are described in Ways to Contribute.
How can I contact the EM-DAT team?
By email at contact@cred.be, or by post at the address given on the Contact page. For commercial licensing, write to Ms. Regina Below, EM-DAT data manager, at regina.below@uclouvain.be (see the Terms of Use).